The bearish case:
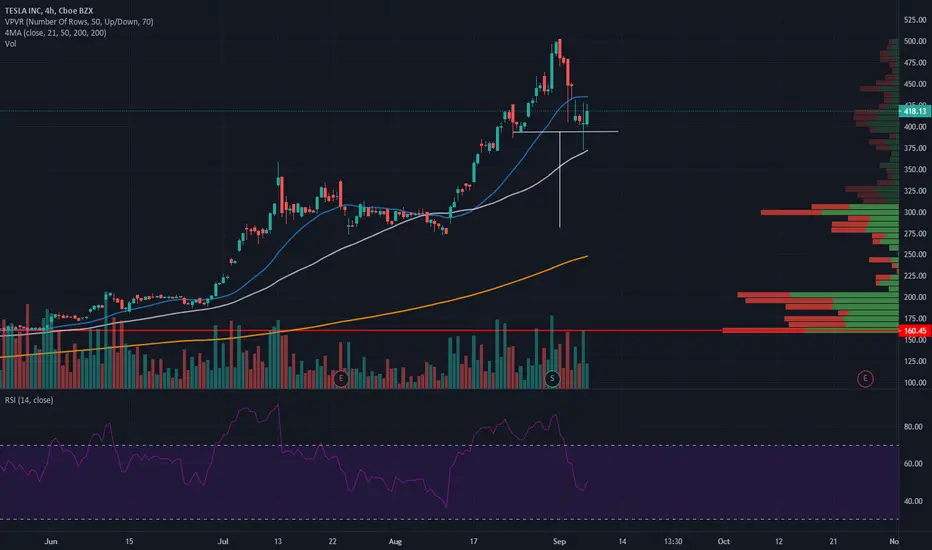
1. There is currently a complex head and shoulders pattern that seems to be forming on the 1HR chart and a head shoulders pattern forming on the 4HR chart. What it almost looked like a breakdown of the pattern was supported by the 4HR 50 moving average that was at about 375. If price price action on the 4HR chart closes below the 50 moving average, that is signal that the pattern will play out. The measured move of the breakdown is at about 280. The 12HR and daily 50 moving average may serve as support on the way down.
2. The weekly and monthly RSI is in overbought territory at about 86 and 92 respectively, which is also a signal a pullback can be expected.
The bullish case:
1. An hourly close above 465 can make a case where the head and shoulders pattern is starting to be negated. A solid hourly close above the previous high of about 505 can make a case that the uptrend continues.
Заметка
*These are purely my speculations and are not financial advice.Отказ от ответственности
Все виды контента, которые вы можете увидеть на TradingView, не являются финансовыми, инвестиционными, торговыми или любыми другими рекомендациями. Мы не предоставляем советы по покупке и продаже активов. Подробнее — в Условиях использования TradingView.
Отказ от ответственности
Все виды контента, которые вы можете увидеть на TradingView, не являются финансовыми, инвестиционными, торговыми или любыми другими рекомендациями. Мы не предоставляем советы по покупке и продаже активов. Подробнее — в Условиях использования TradingView.