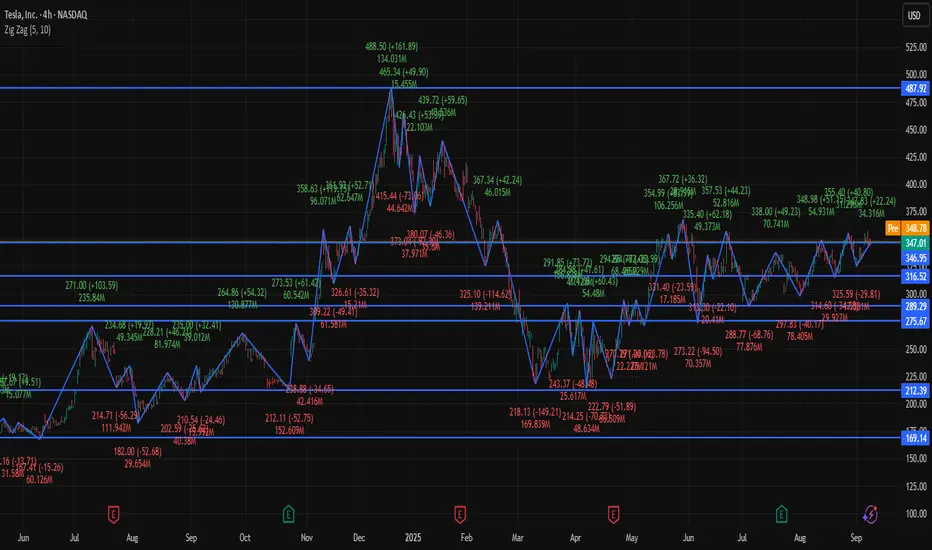
📊 Tesla (TSLA) Snapshot
Current Price: ~$346.97
Recent Range: ~$325 – $358
Intraday Change: Small gain (~+0.2%)
🔎 Key Levels (4H Focus)
Resistance: ~$347 – $351 (immediate ceiling)
Support: ~$325 – $330 (key downside buffer)
📉 Technical Indicators
RSI (14): ~57 → neutral with slight bullish bias
MACD: Positive → upward momentum
Moving Averages: Price trading above 20, 50, 200-period moving averages → bullish trend
Stochastics: Neutral → no overbought/oversold condition
📌 4-Hour Outlook
Bullish Scenario: Break above $347–348 could push price toward $358+.
Bearish Scenario: Drop below $330–332 could test support around $325.
Overall Bias: Moderately bullish; momentum positive but needs to clear resistance for acceleration.
✅ Conclusion: On the 4-hour chart, TSLA is in a moderate bullish phase, trading above key moving averages. The key battle zone is $347–351 for resistance, and $325–330 provides support in case of a pullback.
Отказ от ответственности
Информация и публикации не предназначены для предоставления и не являются финансовыми, инвестиционными, торговыми или другими видами советов или рекомендаций, предоставленных или одобренных TradingView. Подробнее читайте в Условиях использования.
Отказ от ответственности
Информация и публикации не предназначены для предоставления и не являются финансовыми, инвестиционными, торговыми или другими видами советов или рекомендаций, предоставленных или одобренных TradingView. Подробнее читайте в Условиях использования.