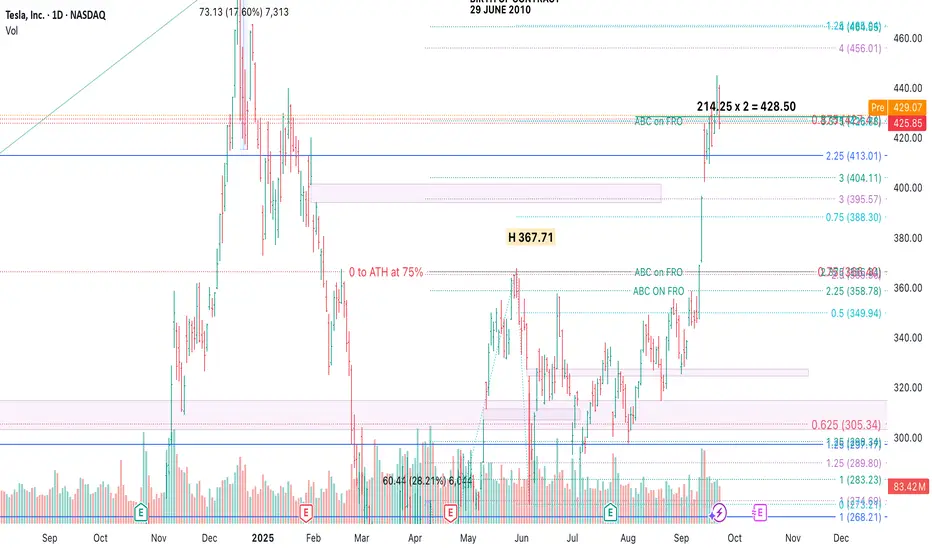
This chart highlights Tesla's price action through a potential ABC pattern, measured time cycles, and trend angles. The move from the April 2025 low to the recent September 2025 high spans 110 calendar days, mirroring a prior 110-day downswing — indicating possible time balance. Volume expansion supports the current uptrend, and we may be approaching a critical price/time resistance area. Watching for confirmation or reversal.
Отказ от ответственности
Все виды контента, которые вы можете увидеть на TradingView, не являются финансовыми, инвестиционными, торговыми или любыми другими рекомендациями. Мы не предоставляем советы по покупке и продаже активов. Подробнее — в Условиях использования TradingView.
Отказ от ответственности
Все виды контента, которые вы можете увидеть на TradingView, не являются финансовыми, инвестиционными, торговыми или любыми другими рекомендациями. Мы не предоставляем советы по покупке и продаже активов. Подробнее — в Условиях использования TradingView.