hey traders,
this Monday I want to share with you my thoughts about dollar yen currency pair.
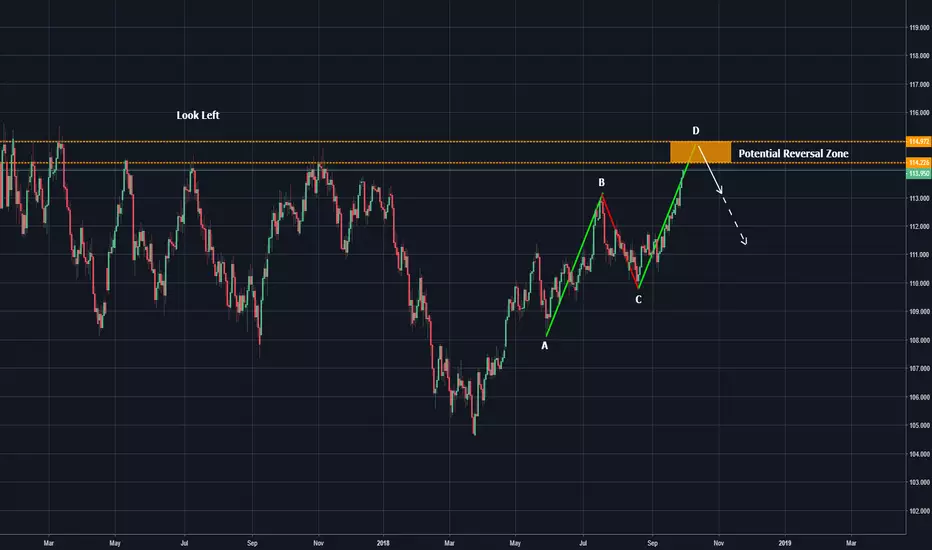
As the market has been violated 113 structure level, I anticipate bullish continuation up until
at least 114 level.
As the market reaches 114 I will be looking for counter trend opportunities.
One of them is this potential bearish abcd pattern.
It is an easily identifiable pattern. Basically, three steps are required:
1) identify impulse leg (in our case it is a steady movement from 108 to 113)
2) identify retracement (113 to 110)
3) projection of impulse leg from C point(110 - the end of retracement)
looking left, and identifying major levels of structure I underlined potential reversal zone where
the market is most likely to reverse.
When the market will reach this zone I will be looking for some confirmation.
Targets are based on structure.
Good luck!
Заметка
entering the zoneЗаметка
pattern is completedЗаметка
t1 hitgoing to second target
✅Join My Telegram Channel: t.me/VasilyTrading
❗️YouTube Channel youtube.com/c/VasilyTrader
✅ Facebook: facebook.com/VasilyTrading/
⭐ My Forex & Gold Broker: bit.ly/vasilyforexbroker ⭐
❗️YouTube Channel youtube.com/c/VasilyTrader
✅ Facebook: facebook.com/VasilyTrading/
⭐ My Forex & Gold Broker: bit.ly/vasilyforexbroker ⭐
Отказ от ответственности
Все виды контента, которые вы можете увидеть на TradingView, не являются финансовыми, инвестиционными, торговыми или любыми другими рекомендациями. Мы не предоставляем советы по покупке и продаже активов. Подробнее — в Условиях использования TradingView.