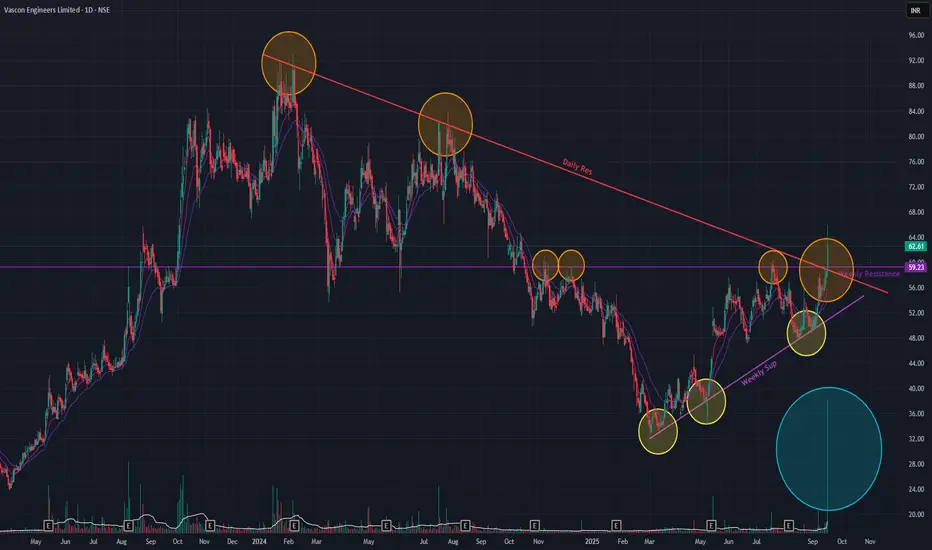
Vascon is showing strong indications of a major trend reversal. After forming a series of higher lows since March 2025, the stock has now broken out of a clear Inverted Head & Shoulder pattern on the weekly timeframe.
The breakout is particularly significant as it occurred at a confluence of two major resistance zones: a long-term horizontal trendline dating back to February 2012 and the more recent descending trendline from January 2024. This bullish move was accompanied by a +7.06% surge on high volume and is supported by a positive crossover in the short-term EMAs.
If the bullish momentum continues, the next potential target is the 86 level. Conversely, a failure to sustain the breakout could see the price retrace to support around the 46 level.
Disclaimer: This analysis is my personal view & for educational purposes only. They shall not be construed as trade or investment advice. Before making any financial decision, it is imperative that you consult with a qualified financial professional.
Отказ от ответственности
Информация и публикации не предназначены для предоставления и не являются финансовыми, инвестиционными, торговыми или другими видами советов или рекомендаций, предоставленных или одобренных TradingView. Подробнее читайте в Условиях использования.