As per the Latest SEBI Mandate, this isn't a Trading/Investment RECOMMENDATION nor for Educational Purposes; it is just for Informational purposes only. The chart data used is 3 Months old, as Showing Live Chart Data is not allowed according to the New SEBI Mandate.
Disclaimer: "I am not a SEBI REGISTERED RESEARCH ANALYST AND INVESTMENT ADVISER."
This analysis is intended solely for informational purposes and should not be interpreted as financial advice. It is advisable to consult a qualified financial advisor or conduct thorough research before making investment decisions.
Price Action Analysis:
- Current Price: ₹887.20 (as per chart)
- 52-Week Range: ₹252 to ₹903
- Market Cap: ₹3,901 Crores
- Recent Performance: Stock has shown exceptional momentum with 171% returns in the past year
Volume Spread Analysis:
- Breakout Volume: Exceptional volume spike during the August 2025 breakout
- Volume Confirmation: Higher volumes on up-moves, lower on corrections
- Accumulation Phase: Steady volume during the consolidation phase indicates smart money accumulation
Chart Patterns:
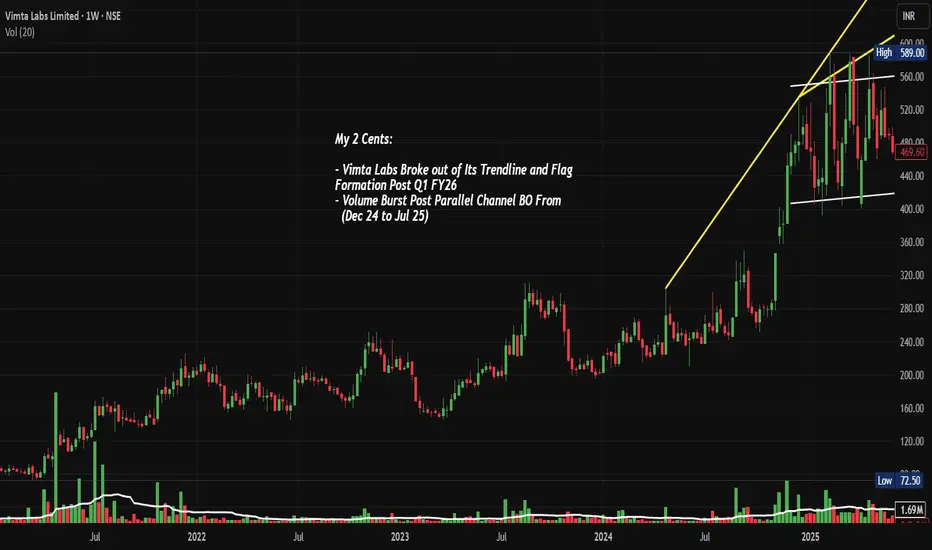
- Long-term Ascending Trendline: Yellow trendline acting as dynamic support since May 2024
- Parallel Channel Breakout: Stock consolidated in a 6-month parallel channel (₹400-550) from December 2024 to July 2025
- Flag and Pennant Formation: Classic continuation pattern post Q1 FY26 results
- Volume Breakout: Massive volume surge accompanying the breakout, confirming genuine momentum
Key Technical Levels:
- Base Formation: ₹400-450 level established during Dec 2024 - Jul 2025 consolidation
- Primary Support: ₹550-600 (previous resistance turned support)
- Secondary Support: ₹500 (parallel channel upper boundary)
- Immediate Resistance: ₹700-750 (psychological levels)
- Final Resistance: ₹900-1000
Fundamental and Sectoral Backdrop:
Company Overview:
- Contract Research and Testing Organization serving biopharmaceutical, food, consumer goods, electronic, electrical, agrochemical, healthcare, and medical device sectors
Financial Performance:
- Q1 FY26 Results: Net profit rose 53.83% to ₹19 Crore, sales increased 30.29% to ₹98 crore
- Recent Quarter: EBITDA margins at 35.7%
- Debt Position: The Company is almost debt-free
Sector Dynamics:
- CRO/CRAMS Sector: Strong tailwinds from global pharmaceutical outsourcing
- Biologics Focus: Company expanding in high-growth biologics testing segment
- Regulatory Compliance: Successfully completed US FDA GCP certification
Other Highlights:
- Consistent revenue growth across quarters
- Strong margin expansion and operational efficiency
- Debt-free balance sheet providing financial flexibility
- Expanding service offerings in high-margin biologics
- Beneficiary of the global pharma outsourcing trend
Key Risk Factors:
- High valuation metrics post recent rally
- Dependence on the pharmaceutical sector cycles
- Regulatory compliance requirements
- Competition from larger CRO players
Market Sentiment:
- Recent 31% surge to hit a new 52-week high of ₹902, reflecting strong investor interest
- Strong institutional interest evidenced by consistent buying
- Positive analyst coverage post strong quarterly results
Full Coverage on my Newsletter this Week
Keep in the Watchlist and DOYR.
NO RECO. For Buy/Sell.
📌Thank you for exploring my idea! I hope you found it valuable.
🙏FOLLOW for more
👍BOOST if you found it useful.
✍️COMMENT below with your views.
Meanwhile, check out my other stock ideas on the right side until this trade is activated. I would love your feedback.
As per the Latest SEBI Mandate, this isn't a Trading/Investment RECOMMENDATION nor for Educational Purposes, it is just for Informational purposes only. The chart data used is 3 Months old, as Showing Live Chart Data is not allowed according to the New SEBI Mandate.
Disclaimer: "I am not a SEBI REGISTERED RESEARCH ANALYST AND INVESTMENT ADVISER."
This analysis is intended solely for informational purposes and should not be interpreted as financial advice. It is advisable to consult a qualified financial advisor or conduct thorough research before making investment decisions.
Похожие публикации
Отказ от ответственности
Информация и публикации не предназначены для предоставления и не являются финансовыми, инвестиционными, торговыми или другими видами советов или рекомендаций, предоставленных или одобренных TradingView. Подробнее читайте в Условиях использования.
Похожие публикации
Отказ от ответственности
Информация и публикации не предназначены для предоставления и не являются финансовыми, инвестиционными, торговыми или другими видами советов или рекомендаций, предоставленных или одобренных TradingView. Подробнее читайте в Условиях использования.