1. Price Structure
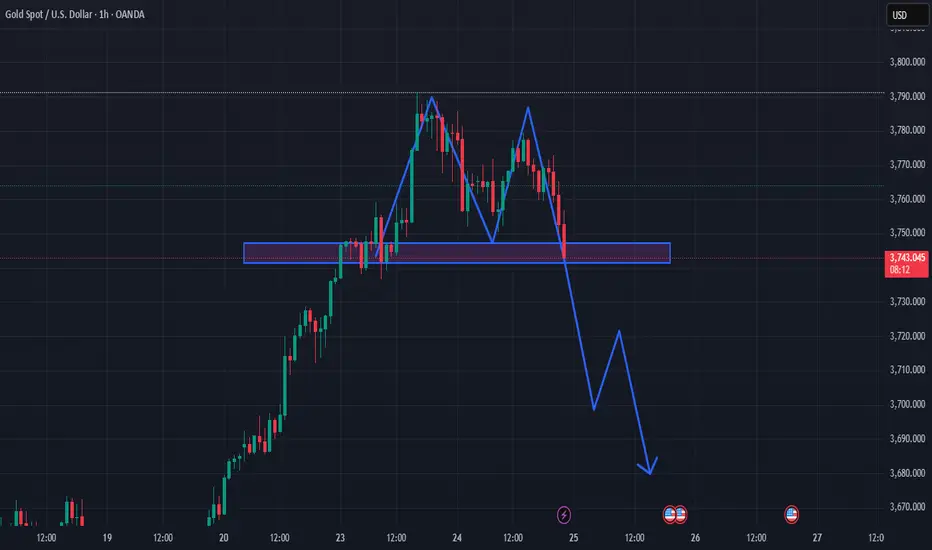
Previous trend: strong uptrend (from the 20th to the 23rd).
After reaching the ~3,790 peak: the market formed two lower highs → a sign of weakness.
The price is now retesting the key support zone around 3,740 – 3,750 (blue box).
2. Technical Pattern
This looks like a Double Top / variant of Head & Shoulders, signaling a bearish reversal.
The blue box area is the neckline – if broken, the pattern completes and the downtrend scenario has high probability.
3. Price Scenarios
If the 3,740 support breaks decisively:
Price may drop quickly towards 3,700 – 3,710 (nearest support).
Further down, it could retest the 3,670 – 3,680 area, as shown by your blue arrow.
If the 3,740 support holds:
Price could bounce back, forming a sideways consolidation before the next move.
However, the probability of a strong recovery is lower, as buying momentum has weakened.
4. Market Sentiment
Retail traders: likely to panic-sell once support breaks, triggering stop-loss cascades.
Big players / institutions: may take advantage around 3,700 to accumulate again after “stop-loss hunting” retailers.
👉 Conclusion: This is a short-term bearish scenario.
For existing long positions, consider taking profit / protecting capital if support breaks.
For dip buyers, it’s safer to wait for a positive reaction around 3,700 – 3,680.
✅MY FREE FOREX & XAUUSD SIGNALS TELEGRAM CHANNEL:
t.me/Jenny_in_your_area
🔴9-12 signals per day
🔴Free knowledge support
🔴24/7 support for newbies.
🔴You always have priority.
JENDA FISH 😘
t.me/Jenny_in_your_area
🔴9-12 signals per day
🔴Free knowledge support
🔴24/7 support for newbies.
🔴You always have priority.
JENDA FISH 😘
Похожие публикации
Отказ от ответственности
Все виды контента, которые вы можете увидеть на TradingView, не являются финансовыми, инвестиционными, торговыми или любыми другими рекомендациями. Мы не предоставляем советы по покупке и продаже активов. Подробнее — в Условиях использования TradingView.