Gold Daily Chart – Final Week of August
Hello traders, let’s discuss the gold outlook for the coming week.
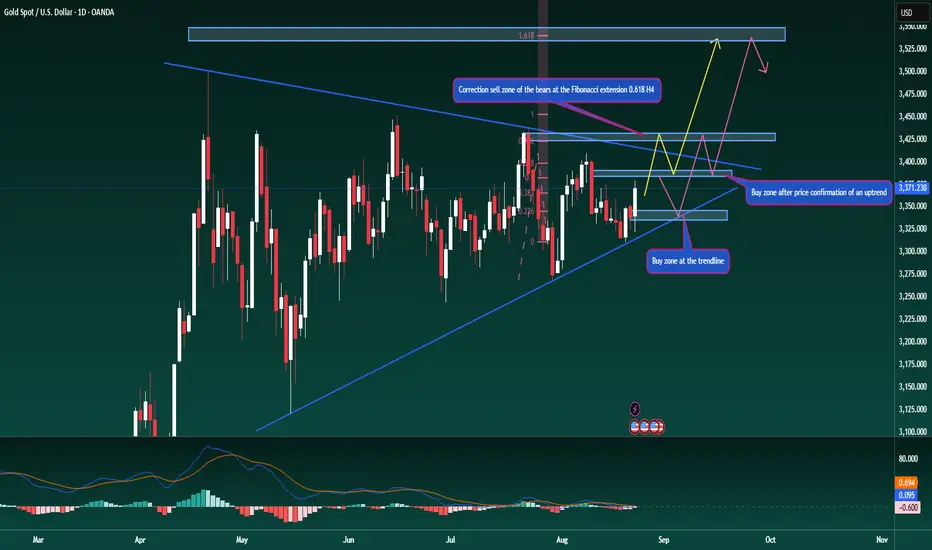
Gold has continued its strong bounce after touching the ascending trendline on the D1 chart, in line with the outlook shared earlier. This move also makes the triangle pattern more valid. For the week ahead, price is likely to trade within the 3330–3410 range, about 80 dollars of movement.
While the long-term expectation is for gold to push towards new ATH levels, a confirmed breakout from this triangle is required first. After such a breakout, a short pullback is possible before the next leg higher (as shown on my chart).
On the H4 chart, Friday’s rally allows us to draw a Fibonacci Extension, pointing towards 3390 and 3430 as higher levels to watch. These zones could act as short-term selling opportunities, based on profit-taking sentiment from buyers.
On the daily timeframe, if the breakout from the triangle plays out, gold could extend as high as 3540, creating a new ATH – this is the long-term scenario. On the downside, if price pulls back, the ascending trendline around 3341 remains a key area to look for new buying opportunities.
Also note, this is the last week of August. On Friday, there could be a liquidity grab to rebalance gold’s value and settle large institutional flows, so caution is advised.
This is my personal outlook for XAUUSD for the week ahead. I hope it helps in building your own trading plan.
Share your thoughts in the comments so we can learn from each other.
Hello traders, let’s discuss the gold outlook for the coming week.
Gold has continued its strong bounce after touching the ascending trendline on the D1 chart, in line with the outlook shared earlier. This move also makes the triangle pattern more valid. For the week ahead, price is likely to trade within the 3330–3410 range, about 80 dollars of movement.
While the long-term expectation is for gold to push towards new ATH levels, a confirmed breakout from this triangle is required first. After such a breakout, a short pullback is possible before the next leg higher (as shown on my chart).
On the H4 chart, Friday’s rally allows us to draw a Fibonacci Extension, pointing towards 3390 and 3430 as higher levels to watch. These zones could act as short-term selling opportunities, based on profit-taking sentiment from buyers.
On the daily timeframe, if the breakout from the triangle plays out, gold could extend as high as 3540, creating a new ATH – this is the long-term scenario. On the downside, if price pulls back, the ascending trendline around 3341 remains a key area to look for new buying opportunities.
Also note, this is the last week of August. On Friday, there could be a liquidity grab to rebalance gold’s value and settle large institutional flows, so caution is advised.
This is my personal outlook for XAUUSD for the week ahead. I hope it helps in building your own trading plan.
Share your thoughts in the comments so we can learn from each other.
🔥 BrianLionCapital – Where Top Traders Unite
✅ Accurate signals & exclusive analysis: 10–15 signals daily with continuous market insights
⏳ Every minute you hesitate is a winning opportunity slipping away!
t.me/+9B0zBuS1rboxZTY1
✅ Accurate signals & exclusive analysis: 10–15 signals daily with continuous market insights
⏳ Every minute you hesitate is a winning opportunity slipping away!
t.me/+9B0zBuS1rboxZTY1
Похожие публикации
Отказ от ответственности
Все виды контента, которые вы можете увидеть на TradingView, не являются финансовыми, инвестиционными, торговыми или любыми другими рекомендациями. Мы не предоставляем советы по покупке и продаже активов. Подробнее — в Условиях использования TradingView.