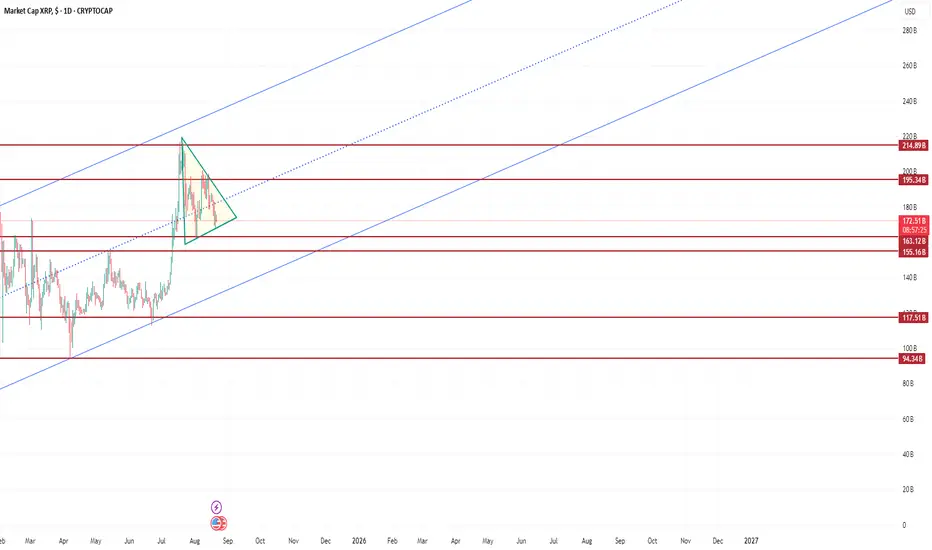
The given line chart illustrates that long-term trend has been clearly upward from nov,2024 by now. After a rapid growth on july 2025, it hit a peak at 219$, then it collapsed to 162$, a strong support line which stopped already chart for many times. Now, chart is inside a triangle and it is fluctuating there between 195 and 162$.
Given these facts, until XRP is between 195 and 162$, it does not expect that it can experiencer an serious increase or decrease. If it can break above the resistance level, 195$, there is opportunity to increase to top of the canale. On the other hand, If it breaks below the support level, 162$, it would decline to the bottom of the canal.
Therefore, the charts id in very crucial condition, and everything depends upon the first break that will it occur through the top or bottom.
Отказ от ответственности
Все виды контента, которые вы можете увидеть на TradingView, не являются финансовыми, инвестиционными, торговыми или любыми другими рекомендациями. Мы не предоставляем советы по покупке и продаже активов. Подробнее — в Условиях использования TradingView.
Отказ от ответственности
Все виды контента, которые вы можете увидеть на TradingView, не являются финансовыми, инвестиционными, торговыми или любыми другими рекомендациями. Мы не предоставляем советы по покупке и продаже активов. Подробнее — в Условиях использования TradingView.