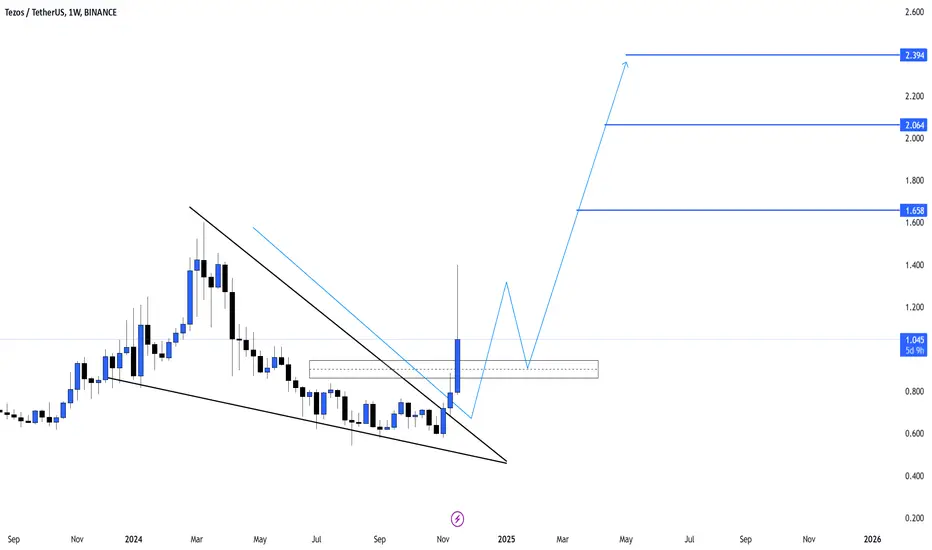
This chart provides a Tezos (XTZ/USDT) analysis on the weekly timeframe, highlighting a potential bullish breakout. Here’s a breakdown of the setup:
Key Observations
Falling Wedge Breakout:
The price has broken out of a long-term falling wedge pattern, which typically signals a bullish reversal.
This breakout marks the end of consolidation and indicates a shift toward upward momentum.
Support and Resistance Levels:
Current Zone: Around $1.045, which serves as a critical re-test area after the breakout.
Targets:
T1: $1.658 – Initial target based on historical resistance.
T2: $2.064 – Mid-term target aligned with previous swing highs.
T3: $2.394 – Longer-term resistance zone.
Projected Path:
After the breakout, the price is expected to re-test the wedge's upper boundary (currently $1.045).
A successful re-test could pave the way for a gradual rally toward higher levels, with potential consolidation phases along the way.
Volume and Momentum:
The breakout candle indicates strong momentum. Sustained volume will be crucial to validate the continuation of this trend.
Outlook and Considerations
Bullish Scenario: Holding above $1.045 and gaining momentum could drive the price to $1.658 and beyond.
Bearish Risks: Falling below the re-test zone ($1.045) might invalidate the bullish setup, leading to renewed selling pressure.
Subscribe to my Telegram Channel 👉 :
t.me/addlist/y5mi70s3c0Y3MDQ0
Subscribe to my X 👉 : x.com/VIPROSETR
t.me/addlist/y5mi70s3c0Y3MDQ0
Subscribe to my X 👉 : x.com/VIPROSETR
Отказ от ответственности
Все виды контента, которые вы можете увидеть на TradingView, не являются финансовыми, инвестиционными, торговыми или любыми другими рекомендациями. Мы не предоставляем советы по покупке и продаже активов. Подробнее — в Условиях использования TradingView.