The ZKUSDT (Daily) pair has reached a critical juncture that will decide its next major move. Since early 2025, price action has been trapped below a descending trendline, acting as a dominant wall of selling pressure. Every breakout attempt has been rejected, reaffirming bearish control.
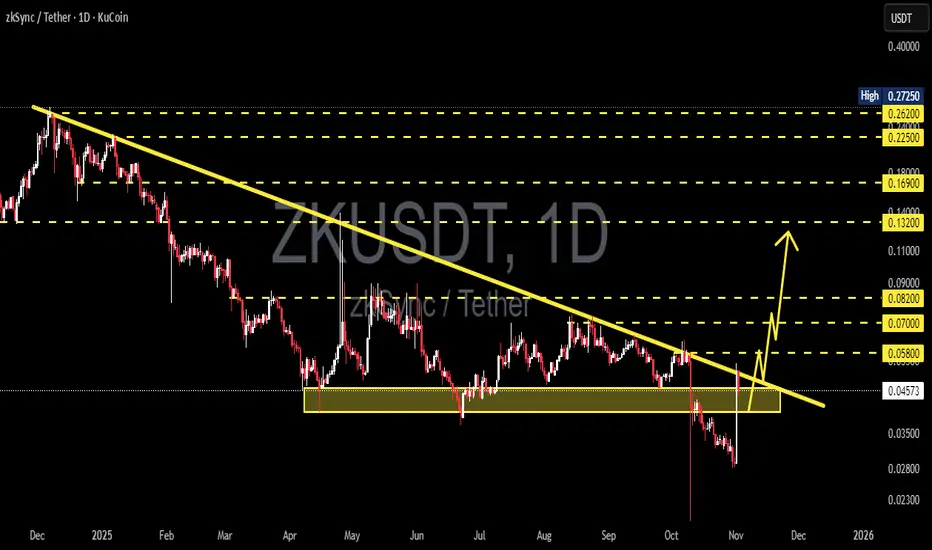
Now, the price is sitting right at the crossroads — between the descending trendline above and a key accumulation/support zone at 0.0465–0.040 (yellow block) below.
This zone isn’t just another range — it’s the battleground that will determine whether ZKSync is preparing for a major reversal or about to continue its downtrend into new lows.
---
Pattern & Structure:
Formation of a Descending Triangle with a flat horizontal base (0.0465–0.040) and a falling trendline resistance.
The structure shows persistent selling pressure, but every dip into the lower zone attracts strong buying reactions — a clear tug-of-war between bulls and bears.
A recent liquidity grab (false breakout wick) signals stop-hunting activity, often a precursor to a major move.
The market is coiling tightly — volatility compression suggests a large expansion phase is near.
---
Bullish Scenario: “Reversal Confirmed”
If ZK successfully closes and holds above the descending trendline with strong momentum and volume, it could mark the start of a new medium-term uptrend.
Key confirmation:
Daily close above 0.048–0.050
Successful retest of the trendline as new support
Upside targets:
1. 0.058 — first resistance and structural pivot
2. 0.070 — confirmation of trend reversal
3. 0.082 → 0.132 — extended bullish targets if momentum continues
Rationale:
Breaking a descending triangle to the upside often triggers a short squeeze as traders exit bearish positions, accelerating price movement and initiating a shift in market structure.
---
Bearish Scenario: “Final Breakdown”
If ZK fails to hold its ground and closes daily below 0.040, the descending triangle pattern would confirm as a bearish continuation, signaling further downside.
Key confirmation:
Strong daily close below 0.040
Failed retest from below (support turned resistance)
Downside targets:
1. 0.028 — previous local low
2. 0.023 — potential capitulation zone
Rationale:
Losing this base indicates buyers have fully lost control. Historically, such breakdowns lead to sharp selloffs as short-term holders exit rapidly, increasing momentum on the downside.
---
Conclusion:
> ZKSync is sitting at a make-or-break level — a zone that will define the next directional wave.
Bullish case: breakout above trendline → targets 0.058–0.070.
Bearish case: breakdown below 0.040 → targets 0.028–0.023.
Expect a major volatility expansion once this compression phase resolves.
---
Trading Strategy & Risk Notes:
Wait for daily candle confirmation, not just wicks — avoid getting trapped in fakeouts.
Conservative entry: after breakout + retest.
Aggressive entry: near support with clear rejection confirmation.
Stop-loss: below 0.040 (for longs) or above 0.0465 (for shorts).
Maintain a risk/reward ratio of at least 1:2 and scale out profits at each target level.
---
Key Technical Levels:
Support zone: 0.0465 – 0.040
Trendline resistance: ~0.048–0.050
Upside levels: 0.058 → 0.070 → 0.082 → 0.132
Downside targets: 0.028 → 0.023
#ZKUSDT #ZKSync #CryptoAnalysis #DescendingTriangle #BreakoutTrading #SupportResistance #CryptoBreakout #ChartAnalysis #PriceAction #CryptoTrader #ReversalZone #BearishOrBullish
✅ Get Free Signals! Join Our Telegram Channel Here: t.me/TheCryptoNuclear
✅ Twitter: twitter.com/crypto_nuclear
✅ Join Bybit : partner.bybit.com/b/nuclearvip
✅ Benefits : Lifetime Trading Fee Discount -50%
✅ Twitter: twitter.com/crypto_nuclear
✅ Join Bybit : partner.bybit.com/b/nuclearvip
✅ Benefits : Lifetime Trading Fee Discount -50%
Отказ от ответственности
Все виды контента, которые вы можете увидеть на TradingView, не являются финансовыми, инвестиционными, торговыми или любыми другими рекомендациями. Мы не предоставляем советы по покупке и продаже активов. Подробнее — в Условиях использования TradingView.