PROTECTED SOURCE SCRIPT
[MBBTI] BTC Thot

Hello Traders,
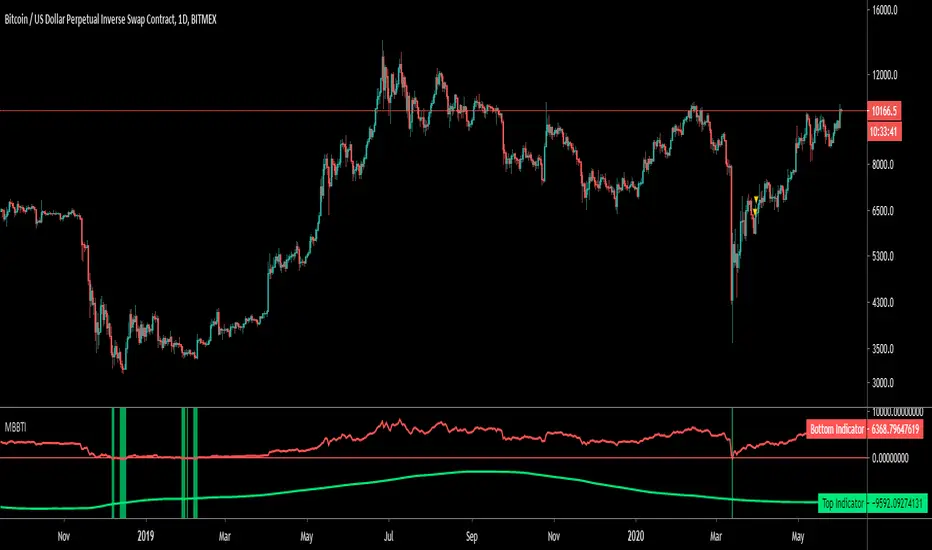
Thot is indicator which utilizes moving averages to indicate the potential high or bottom.
How it works?
- it utilizes different moving averages and weighting them with fibonacci multiples.
- some crosses proved indicating highs and lows in the past
- red indicates potential high
- green indicates potential low
- only good on daily chart
- check BLX for past performance
Note: This is based on past performance an not quarantining any future performance.
Contact me if you have any questions or change requests
Wuuzzaa
Скрипт с защищённым кодом
Этот скрипт опубликован с закрытым исходным кодом. Однако вы можете использовать его свободно и без каких-либо ограничений — читайте подробнее здесь.
Отказ от ответственности
Информация и публикации не предназначены для предоставления и не являются финансовыми, инвестиционными, торговыми или другими видами советов или рекомендаций, предоставленных или одобренных TradingView. Подробнее читайте в Условиях использования.