TIME Indicator – CET (hour-based) + Bias Forecast + Alerts [EN]
What it does
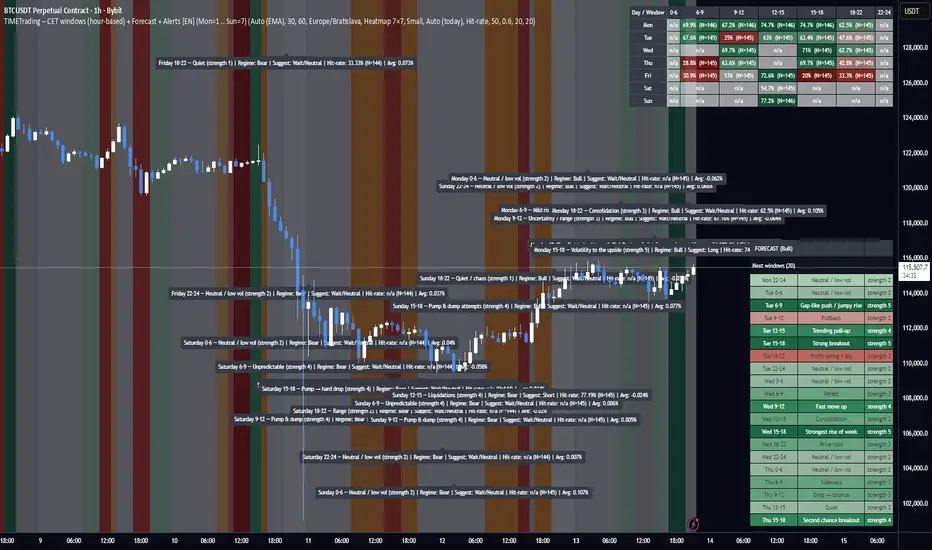
Splits each day (CET/CEST) into 7 fixed time windows: 0–6, 6–9, 9–12, 12–15, 15–18, 18–22, 22–24.
Detects market regime (Bull/Bear/Neutral) automatically from an HTF EMA (configurable), or you can set the regime manually.
Maps each day-of-week × window to an expected behavior (Bull/Bear/Neutral/Chop) with strength 1–5 (your research schedule).
Backtests on-the-fly: logs each finished window’s return to compute:
Hit-rate (directional accuracy on Bull/Bear calls)
Average % move (log-return → %)
t-stat (significance)
Observation counts N
Visualizes results via:
Heatmap 7×7 (Days × Windows) with selectable metric (Hit-rate / Avg% / t-stat)
Day (paged) table
Split 2× (long) tables to fit small screens
Forecast panel: shows the next N windows (default 8) with labels and color tint based on category + strength. Uses CET midday anchoring to avoid day-shift bugs.
Regime logic
HTF EMA (length configurable) on a selectable timeframe (HTF for regime/tfStats).
“Bull” when price > EMA (optionally EMA slope > 0); “Bear” when price < EMA (slope < 0); else “Neutral”.
Tip: for 1h charts use tfStats=240 (4h) for a stable bias; for 2h charts consider 240–360; swing traders can go 360–720.
Color language
Green shades = Bull (strength 1–5)
Red shades = Bear (1–5)
Orange = Chop (1–5)
Gray = Neutral/Range (1–5)
Optional: neutral/chop can be tinted by current regime (setting).
Alerts (3 modes)
Every window (baseline) – fires at the start of each window, always (for manual verification).
Qualified window – fires at window start only if stats meet your thresholds: Min N, Min Hit-rate.
Hourly ping (CET) – optional every-hour reminder (also mid-window).
Alert message example
Monday 6–9 — Mild rise (strength 2) | Regime: Bull | Suggest: Long
Hit-rate: 87.4% (N=215) | Avg: 0.23%
Key implementation details
Uses CET/CEST consistently. “Today” is stabilized by CET midday to prevent DOW misalignment across session boundaries.
Windows are computed from CET hour, not exchange sessions, so it’s robust across assets/timezones as long as you want CET logic.
Statistics are maintained in arrays (7×7); each completed window updates N, sum of returns, sum of squares, directional hits, etc.
Heatmap cells compute metric + color strength dynamically; you can switch the displayed metric from the input.
Inputs (most useful)
Market regime: Auto (EMA) / Bull / Bear / Neutral
EMA length (Auto), HTF for regime (minutes), Require slope
Results view: Heatmap 7×7 / Day (paged) / Split 2× (long)
Heatmap metric: Hit-rate / Avg % / t-stat
Forecast: number of upcoming windows, color opacity, tint neutral by regime
Alerts: enable baseline/qualified/hourly, thresholds Min N, Min Hit-rate
How to use
Pick your chart TF (e.g., 1h). Set HTF for regime (e.g., 240) and EMA length (e.g., 100). Keep Require slope = ON for cleaner bias.
Start on Heatmap 7×7 to spot strong day×window pockets. Then use Forecast to see what’s next today/tomorrow.
Turn on ALERT: Every window to get a message at the start of every window; optionally add Qualified for filtered calls.
In TradingView Alerts dialog choose “Any alert() function call” to receive all alert types.
Limitations / notes
This is a statistical bias tool, not a signal generator. Combine with price action, liquidity zones, vol regime, news.
Hit-rates and averages depend on your symbol/timeframe history; results differ across assets and time ranges.
EMA-based regime is HTF-closed; bias flips only after the higher-timeframe bar confirms.
Changelog snapshot (current build)
Pine v6; fixed DOW alignment via CET midday; refactored forecast (next N windows), new baseline/qualified/hourly alerts, color-tinted neutral/chop, improved table layout and text sizing.
If you want, I can also write a short “How to request access” blurb for your private/hidden publication page.
Instructions to Traders
What this tool shows
Day split (CET/CEST): 0–6, 6–9, 9–12, 12–15, 15–18, 18–22, 22–24.
For each Day × Window it displays the expected behavior (Bull/Bear/Neutral/Chop) and strength 1–5 based on historical stats.
Heatmap metrics: Hit-rate, Avg % move, or t-stat.
Quick setup
Chart TF: start on 1h (works on 30m–2h too).
HTF for regime (EMA bias):
1h chart → 240 (4h) recommended
2h chart → 240–360
Swing (4h/1D) → 360–720
EMA length: 100 (default). Keep Require slope = ON for cleaner Bull/Bear bias.
View: start with Heatmap 7×7, then try Forecast to see the next windows.
Forecast panel
Shows the next N upcoming windows (default 8), with labels and color by category + strength.
Uses CET midday anchoring to keep weekdays correct (no “day shift” at midnight).
Alerts
Enable ALERT: Every window (no filters) to get a message at the start of every window.
Optionally enable ALERT: Only when N & Hit-rate ok (filtered alerts) and ALERT: Every hour (CET) ping (hourly reminder).
In TradingView’s Create Alert dialog, select “Any alert() function call” to receive all alert types.
Alert text includes: Day + Window, regime, suggestion (Long/Short/Wait), Hit-rate, N, Avg %.
How to use the bias
Treat it as a context/expectation map, not a blind signal.
Combine with structure (HH/HL, S/R), liquidity, volatility regime, and risk management.
Stronger shades (4–5) = stronger historical tendency; still validate with live price action.
Troubleshooting
Day names wrong? Ensure Timezone = Europe/Bratislava (CET/CEST) in inputs.
“No data / n/a”: load more chart history or switch to a symbol with longer data.
Regime feels too jumpy/laggy: adjust HTF for regime and/or EMA length.
Access / contact
If this script is private and you need access, send your TradingView username with the subject “TIMETrading access”.
For support/feedback: describe your symbol, chart TF, HTF setting, and a screenshot.
Disclaimer: Statistical tendencies ≠ certainty. This is educational research, not financial advice. Always use stops and size risk responsibly.
Скрипт с ограниченным доступом
Доступ к этому скрипту имеют только пользователи, одобренные автором. Вам необходимо запросить и получить разрешение на его использование. Обычно оно предоставляется после оплаты. Для получения подробной информации следуйте инструкциям автора ниже или свяжитесь напрямую с Denyzzzz.
TradingView НЕ рекомендует оплачивать или использовать скрипт, если вы полностью не доверяете его автору и не понимаете, как он работает. Вы также можете найти бесплатные, открытые альтернативы в наших скриптах сообщества.
Инструкции от автора
Отказ от ответственности
Скрипт с ограниченным доступом
Доступ к этому скрипту имеют только пользователи, одобренные автором. Вам необходимо запросить и получить разрешение на его использование. Обычно оно предоставляется после оплаты. Для получения подробной информации следуйте инструкциям автора ниже или свяжитесь напрямую с Denyzzzz.
TradingView НЕ рекомендует оплачивать или использовать скрипт, если вы полностью не доверяете его автору и не понимаете, как он работает. Вы также можете найти бесплатные, открытые альтернативы в наших скриптах сообщества.