PROTECTED SOURCE SCRIPT
Arbitrage Spread v1 : 1 pair + 1 chart [Arby.Trade]
Обновлено
This indicator allows you to track in real time the change in the spread (the difference in the exchange rate) between two assets.
How does the indicator work?
In the indicator settings menu, the user selects two trading pairs, for example BTCUSDT on the Binance exchange and BTCUSDT on the Bybit exchange, after which the script will receive prices from both exchanges and compare them with each other, calculating the percentage deviation between prices (spread). The script can only work with those assets and exchanges that are on board TradingView.
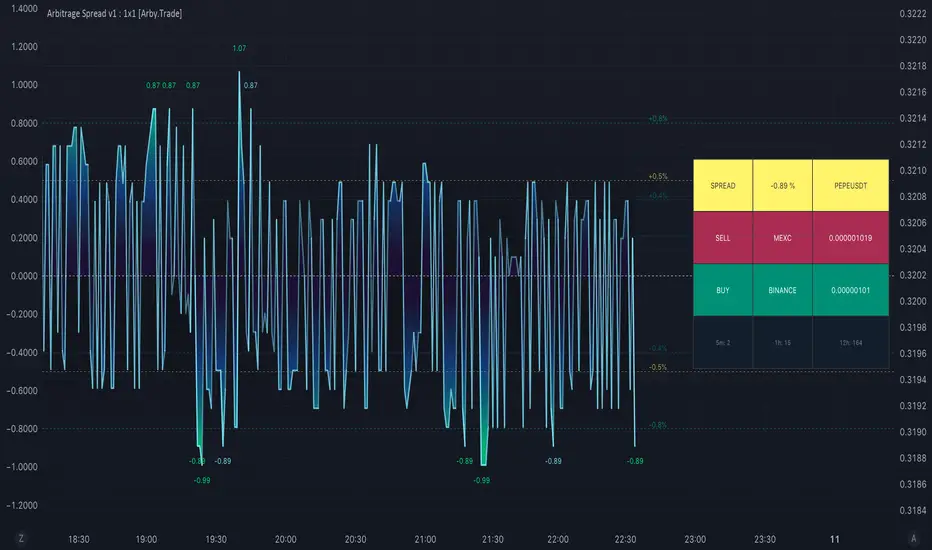
According to the calculated spread value, the spread line is displayed on the screen. This line moves between values above zero and below. When the spread line is below zero, it means that the price of the asset on the first exchange is less than on the second. That is, by buying an asset on the first exchange and selling it on the second one, you can earn money (of course, it is important to take into account the commissions of the exchanges for these transactions). When the spread line is above zero, the opposite is true. When the spread is zero, the prices on both exchanges are the same and there is no arbitrage situation.
Indicator settings.
For a better visual representation of the current spread value, the indicator has the ability to set two threshold spread levels. The first threshold level is the level below which the spread is not interesting to the trader and he will not consider arbitrage deals. The second threshold level is the level of a particularly high spread. When the spread value exceeds the second threshold level, the spread values will be signed above the spread line, and the extreme values for the user-defined period of bars back will be additionally highlighted in a brighter color. Both threshold levels are displayed on the chart and the user can change their values in the indicator settings menu.
Alerts.
Additionally, you can set the threshold value of the spread, at which the script will send notifications from TradingView. We called it the Spread Signal Threshold. This threshold level has nothing to do with the visual thresholds described above. You can set a signal level exceeding the second visual threshold or make it lower, but it is important to understand that TradingView alerts will only be triggered if the Spread Signal Threshold is exceeded.
To set up alerts, open the "Alerts" tab in the TradingView menu on the right. Click the "Create Alert" button. Then, in the window that opens, select this indicator in the "Condition" line. After that, you can set a name for this alert and complete the notification setup by clicking the "Create" button.
We, the authors of this script, have been engaged in cryptocurrency arbitrage for a long time and, first of all, created it for ourselves and our daily arbitrage trading, but this does not prevent you from using it at your discretion for any types of assets and in any markets.
--
Данный индикатор позволяет отслеживать в реальном времени изменение спреда (разницы в курсе) между двумя активами.
Как устроен индикатор?
В меню настроек индикатора пользователь выбирает две торговые пары, например BTCUSDT на бирже Binance и BTCUSDT на бирже Bybit, после чего скрипт получит цены с обеих бирж и сравнит их между собой, рассчитав процентное отклонение между ценами (спред). Скрипт может работать только с теми активами и биржами, которые есть на борту TradingView, и это не мало.
По рассчитанному значению спреда на экран выводится линия спреда. Данная линия двигается между значениями то выше нуля, то ниже. Когда линия спреда ниже нуля это значит что цена на актив на первой бирже меньше, чем на второй. То есть, купив актив на первой бирже и продав его на второй можно заработать (конечно при этом важно учитывать комиссии бирж на совершение данных сделок). Когда линия спреда выше нуля - наоборот. Когда спред равен нулю - цены на обеих биржах одинаковы и арбитражная ситуация отсутствует.
Настройки индикатора.
Для лучшего визуального представления о текущем значении спреда индикатор имеет возможность задать два пороговых уровня спреда. Первый пороговый уровень – это уровень, ниже которого спред не интересен трейдеру и он не будет рассматривать арбитражные сделки. Второй пороговый уровень – это уровень особенно повышенного спреда. Когда значение спреда превышает второй пороговый уровень над линией спреда будут подписаны значения спреда, а экстремальные значения за заданный пользователем период баров назад будут дополнительно выделены более ярким цветом. Оба пороговых уровня отображаются на графике и пользователь может менять их значения в меню настроек индикатора.
Уведомления.
Дополнительно можно настроить пороговое значение спреда, при достижении которого скрипт будет отправлять уведомления от TradingView. Мы назвали это Spread Signal Threshold. Этот пороговый уровень никак не связан с визуальными пороговыми уровнями, описанными выше. Вы можете задать сигнальный уровень превышающий второй визуальный пороговый уровень или сделать его ниже, но важно понимать, что оповещения TradingView будут срабатывать только от превышения именно Spread Signal Threshold.
Для настройки оповещений откройте вкладку «Оповещения» в меню TradingView справа. Нажмите кнопку «Создать оповещение». Затем в открывшемся окне в строке «Условие» выберете данный индикатор. После чего вы можете задать название данному оповещению и завершить настройку оповещения, нажав кнопку «Создать».
Мы, авторы данного скрипта, давно занимаемся арбитражем криптовалюты и, в первую очередь, создавали его для себя и своей каждодневной арбитражной торговли, но это не мешает вам использовать его по своему усмотрению для любых видов активов и на любых рынках.
How does the indicator work?
In the indicator settings menu, the user selects two trading pairs, for example BTCUSDT on the Binance exchange and BTCUSDT on the Bybit exchange, after which the script will receive prices from both exchanges and compare them with each other, calculating the percentage deviation between prices (spread). The script can only work with those assets and exchanges that are on board TradingView.
According to the calculated spread value, the spread line is displayed on the screen. This line moves between values above zero and below. When the spread line is below zero, it means that the price of the asset on the first exchange is less than on the second. That is, by buying an asset on the first exchange and selling it on the second one, you can earn money (of course, it is important to take into account the commissions of the exchanges for these transactions). When the spread line is above zero, the opposite is true. When the spread is zero, the prices on both exchanges are the same and there is no arbitrage situation.
Indicator settings.
For a better visual representation of the current spread value, the indicator has the ability to set two threshold spread levels. The first threshold level is the level below which the spread is not interesting to the trader and he will not consider arbitrage deals. The second threshold level is the level of a particularly high spread. When the spread value exceeds the second threshold level, the spread values will be signed above the spread line, and the extreme values for the user-defined period of bars back will be additionally highlighted in a brighter color. Both threshold levels are displayed on the chart and the user can change their values in the indicator settings menu.
Alerts.
Additionally, you can set the threshold value of the spread, at which the script will send notifications from TradingView. We called it the Spread Signal Threshold. This threshold level has nothing to do with the visual thresholds described above. You can set a signal level exceeding the second visual threshold or make it lower, but it is important to understand that TradingView alerts will only be triggered if the Spread Signal Threshold is exceeded.
To set up alerts, open the "Alerts" tab in the TradingView menu on the right. Click the "Create Alert" button. Then, in the window that opens, select this indicator in the "Condition" line. After that, you can set a name for this alert and complete the notification setup by clicking the "Create" button.
We, the authors of this script, have been engaged in cryptocurrency arbitrage for a long time and, first of all, created it for ourselves and our daily arbitrage trading, but this does not prevent you from using it at your discretion for any types of assets and in any markets.
--
Данный индикатор позволяет отслеживать в реальном времени изменение спреда (разницы в курсе) между двумя активами.
Как устроен индикатор?
В меню настроек индикатора пользователь выбирает две торговые пары, например BTCUSDT на бирже Binance и BTCUSDT на бирже Bybit, после чего скрипт получит цены с обеих бирж и сравнит их между собой, рассчитав процентное отклонение между ценами (спред). Скрипт может работать только с теми активами и биржами, которые есть на борту TradingView, и это не мало.
По рассчитанному значению спреда на экран выводится линия спреда. Данная линия двигается между значениями то выше нуля, то ниже. Когда линия спреда ниже нуля это значит что цена на актив на первой бирже меньше, чем на второй. То есть, купив актив на первой бирже и продав его на второй можно заработать (конечно при этом важно учитывать комиссии бирж на совершение данных сделок). Когда линия спреда выше нуля - наоборот. Когда спред равен нулю - цены на обеих биржах одинаковы и арбитражная ситуация отсутствует.
Настройки индикатора.
Для лучшего визуального представления о текущем значении спреда индикатор имеет возможность задать два пороговых уровня спреда. Первый пороговый уровень – это уровень, ниже которого спред не интересен трейдеру и он не будет рассматривать арбитражные сделки. Второй пороговый уровень – это уровень особенно повышенного спреда. Когда значение спреда превышает второй пороговый уровень над линией спреда будут подписаны значения спреда, а экстремальные значения за заданный пользователем период баров назад будут дополнительно выделены более ярким цветом. Оба пороговых уровня отображаются на графике и пользователь может менять их значения в меню настроек индикатора.
Уведомления.
Дополнительно можно настроить пороговое значение спреда, при достижении которого скрипт будет отправлять уведомления от TradingView. Мы назвали это Spread Signal Threshold. Этот пороговый уровень никак не связан с визуальными пороговыми уровнями, описанными выше. Вы можете задать сигнальный уровень превышающий второй визуальный пороговый уровень или сделать его ниже, но важно понимать, что оповещения TradingView будут срабатывать только от превышения именно Spread Signal Threshold.
Для настройки оповещений откройте вкладку «Оповещения» в меню TradingView справа. Нажмите кнопку «Создать оповещение». Затем в открывшемся окне в строке «Условие» выберете данный индикатор. После чего вы можете задать название данному оповещению и завершить настройку оповещения, нажав кнопку «Создать».
Мы, авторы данного скрипта, давно занимаемся арбитражем криптовалюты и, в первую очередь, создавали его для себя и своей каждодневной арбитражной торговли, но это не мешает вам использовать его по своему усмотрению для любых видов активов и на любых рынках.
Информация о релизе
This indicator allows you to track in real time the change in the spread (the difference in the exchange rate) between two assets.How does the indicator work?
In the indicator settings menu, the user selects two trading pairs, for example BTCUSDT on the Binance exchange and BTCUSDT on the Bybit exchange, after which the script will receive prices from both exchanges and compare them with each other, calculating the percentage deviation between prices (spread). The script can only work with those assets and exchanges that are on board TradingView.
According to the calculated spread value, the spread line is displayed on the screen. This line moves between values above zero and below. When the spread line is below zero, it means that the price of the asset on the first exchange is less than on the second. That is, by buying an asset on the first exchange and selling it on the second one, you can earn money (of course, it is important to take into account the commissions of the exchanges for these transactions). When the spread line is above zero, the opposite is true. When the spread is zero, the prices on both exchanges are the same and there is no arbitrage situation.
Indicator settings.
For a better visual representation of the current spread value, the indicator has the ability to set two threshold spread levels. The first threshold level is the level below which the spread is not interesting to the trader and he will not consider arbitrage deals. The second threshold level is the level of a particularly high spread. When the spread value exceeds the second threshold level, the spread values will be signed above the spread line, and the extreme values for the user-defined period of bars back will be additionally highlighted in a brighter color. Both threshold levels are displayed on the chart and the user can change their values in the indicator settings menu.
Alerts.
Additionally, you can set the threshold value of the spread, at which the script will send notifications from TradingView. We called it the Spread Signal Threshold. This threshold level has nothing to do with the visual thresholds described above. You can set a signal level exceeding the second visual threshold or make it lower, but it is important to understand that TradingView alerts will only be triggered if the Spread Signal Threshold is exceeded.
To set up alerts, open the "Alerts" tab in the TradingView menu on the right. Click the "Create Alert" button. Then, in the window that opens, select this indicator in the "Condition" line. After that, you can set a name for this alert and complete the notification setup by clicking the "Create" button.
We, the authors of this script, have been engaged in cryptocurrency arbitrage for a long time and, first of all, created it for ourselves and our daily arbitrage trading, but this does not prevent you from using it at your discretion for any types of assets and in any markets.
--
Данный индикатор позволяет отслеживать в реальном времени изменение спреда (разницы в курсе) между двумя активами.
Как устроен индикатор?
В меню настроек индикатора пользователь выбирает две торговые пары, например BTCUSDT на бирже Binance и BTCUSDT на бирже Bybit, после чего скрипт получит цены с обеих бирж и сравнит их между собой, рассчитав процентное отклонение между ценами (спред). Скрипт может работать только с теми активами и биржами, которые есть на борту TradingView, и это не мало.
По рассчитанному значению спреда на экран выводится линия спреда. Данная линия двигается между значениями то выше нуля, то ниже. Когда линия спреда ниже нуля это значит что цена на актив на первой бирже меньше, чем на второй. То есть, купив актив на первой бирже и продав его на второй можно заработать (конечно при этом важно учитывать комиссии бирж на совершение данных сделок). Когда линия спреда выше нуля - наоборот. Когда спред равен нулю - цены на обеих биржах одинаковы и арбитражная ситуация отсутствует.
Настройки индикатора.
Для лучшего визуального представления о текущем значении спреда индикатор имеет возможность задать два пороговых уровня спреда. Первый пороговый уровень – это уровень, ниже которого спред не интересен трейдеру и он не будет рассматривать арбитражные сделки. Второй пороговый уровень – это уровень особенно повышенного спреда. Когда значение спреда превышает второй пороговый уровень над линией спреда будут подписаны значения спреда, а экстремальные значения за заданный пользователем период баров назад будут дополнительно выделены более ярким цветом. Оба пороговых уровня отображаются на графике и пользователь может менять их значения в меню настроек индикатора.
Уведомления.
Дополнительно можно настроить пороговое значение спреда, при достижении которого скрипт будет отправлять уведомления от TradingView. Мы назвали это Spread Signal Threshold. Этот пороговый уровень никак не связан с визуальными пороговыми уровнями, описанными выше. Вы можете задать сигнальный уровень превышающий второй визуальный пороговый уровень или сделать его ниже, но важно понимать, что оповещения TradingView будут срабатывать только от превышения именно Spread Signal Threshold.
Для настройки оповещений откройте вкладку «Оповещения» в меню TradingView справа. Нажмите кнопку «Создать оповещение». Затем в открывшемся окне в строке «Условие» выберете данный индикатор. После чего вы можете задать название данному оповещению и завершить настройку оповещения, нажав кнопку «Создать».
Мы, авторы данного скрипта, давно занимаемся арбитражем криптовалюты и, в первую очередь, создавали его для себя и своей каждодневной арбитражной торговли, но это не мешает вам использовать его по своему усмотрению для любых видов активов и на любых рынках.
Информация о релизе
A counter for the number of arbitrage situations on the selected trading pair for three time periods has been added to the indicator. Each time the spread value of the Signal Threshold Level is exceeded the counter will add one. The counter takes into account only those arbitrage situations that were on the market during the time period back from the current moment. For example, for a 1-hour counter period, it will show the number of arbitration situations in the last 1 hour. This counter will allow you to evaluate the prospects of arbitrage of the selected trading pair. For example, if the number of arbitrage situations on the selected trading pair was 1-2 within an hour, then it is obvious that it is better not to waste time waiting for another such situation on this pair and look for the next one.
For the most effective use of the indicator, we recommend using the following approach: in order to pre-evaluate the nature of the spread movement and the frequency of arbitrage situations on the selected trading pair, choose the senior timeframe of the main chart (5m or 1H), so the results will be rough, but will give a general idea of the potential of the selected pair for arbitration. For a more accurate analysis and the work itself, use the minimum timeframe available for your TradingView subscription – minute or second – so the results of calculations of the spread and the number of arbitrage situations on the selected pair will be the most accurate.
This feature is due to the fact that calculations and plotting are based on the results of closing bars. Therefore, the higher the timeframe, the fewer closed bars (confirmed data) – the chart and data are rougher. But the lower the timeframe, the more data, the higher the update frequency – the more accurate the graph and calculations. However, this does not affect the display of current prices and the current spread value – they are always up-to-date and displayed as quickly as possible as soon as the performance of TradingView and incoming data from exchanges allows.
In this version of the indicator, you can track arbitrage situations for one trading pair. If this is not enough for you, check out other versions of this indicator on our TradingView page.
-
В индикатор добавлен счетчик количества арбитражных ситуаций на выбранной торговой паре по трем временным периодам. При каждом превышении значения спреда уровня Signal Threshold Level счетчик будет прибавлять единицу. Счетчик учитывает только те арбитражные ситуации, которые были на рынке в течение временного периода назад от текущего момента. К примеру, для 1-часового периода (1h) счетчика он будет показывать количество арбитражных ситуаций за последний час.
Этот счетчик позволит оценить перспективность арбитража выбранной торговой пары. К примеру, если количество арбитражных ситуаций на выбранной торговой паре в течение часа было 1-2, то очевидно, что лучше не тратить время на ожидание очередной такой ситуации на данной паре и поискать следующую.
Для наиболее эффективного использования индикатора мы рекомендуем применять следующий подход: для того чтобы предварительно оценить характер движения спреда и частоту возникновения арбитражных ситуаций на выбранной торговой паре, выбирайте старший таймфрем основного графика (5м или 1Н), так результаты будут грубыми, но дадут общее представление о потенциале выбранной пары для арбитража. Для более точного анализа и непосредственно самой работы используйте минимально доступный для вашей подписки TradingView таймфрейм – минутный или секундный – так результаты расчетов спреда и количества возникновения арбитражных ситуаций на выбранной паре будут наиболее точными.
Такая особенность связана с тем, что расчеты и построение графика строятся по результатам закрытия баров. Поэтому чем выше таймфрейм тем меньше закрытых баров (подтвержденных данных) – график и данные более грубые. А чем ниже таймфрейм, тем больше данных, выше частота обновления – точнее график и расчеты. Тем не менее, на отображение текущих цен и текущего значения спреда это не влияет – они всегда актуальные и отображаются максимально быстро как только позволяет производительность TradingView и поступающих данных с бирж.
В этой версии индикатора можно отслеживать арбитражные ситуации по одной торговой паре. Если вам этого недостаточно - посмотрите другие версии данного индикатора на нашей странице TradingView.
Отказ от ответственности
Все виды контента, которые вы можете увидеть на TradingView, не являются финансовыми, инвестиционными, торговыми или любыми другими рекомендациями. Мы не предоставляем советы по покупке и продаже активов. Подробнее — в Условиях использования TradingView.