PROTECTED SOURCE SCRIPT
Trend Strength by Atilla Yurtseven
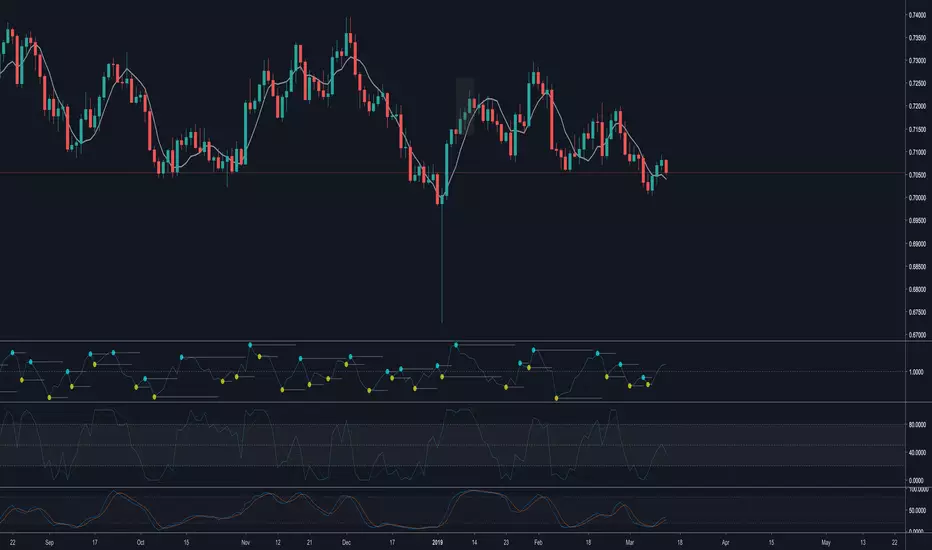
This is the indicator that I have developed to analyse the trends. You can choose your favorite trend indicators from the list. I mostly use Linear. You can enable oscillator mode as well.
What does this indicator tell me?
This indicator simply shows you prices in a horizontal space. Assuming you are using simple moving average. Calculation is "price - moving_average_value" (or "price / moving_average_value in Rate mode). Once you do this, you see the prices move around above or below the base line. By using this indicator, you can find out how far you are from your moving average. If the price is lower than base line and it's very far away from it, this means that price is cheap and vice versa.
IMPORTANT:
Lots of traders use such indicators in a wrong way and lots of trainers teach this strategy wrong way. They always tell you to buy once the price cross over a moving average. I would never buy something if it is above the moving average. I'll just let it go. Or I will never short sell below MA which means it's already cheap and i would look for buying opportunity only.
DISCLAIMER:
This is not financial advice.
Follow me to get notified when i publish new indicators, educational posts or trading signals.
Trade safe,
Atilla Yurtseven
Скрипт с защищённым кодом
Этот скрипт опубликован с закрытым исходным кодом. Однако вы можете использовать его свободно и без каких-либо ограничений — читайте подробнее здесь.
I know Kung-Fu!
Отказ от ответственности
Информация и публикации не предназначены для предоставления и не являются финансовыми, инвестиционными, торговыми или другими видами советов или рекомендаций, предоставленных или одобренных TradingView. Подробнее читайте в Условиях использования.