OPEN-SOURCE SCRIPT
Обновлено Dema Percentile Standard Deviation

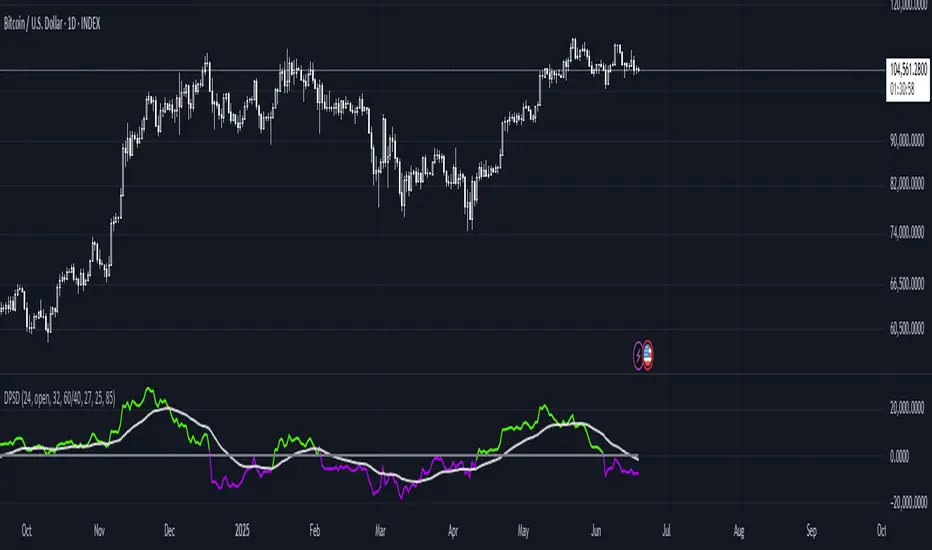
Dema Percentile Standard Deviation
The Dema Percentile Standard Deviation indicator is a robust tool designed to identify and follow trends in financial markets.
How it works?
This code is straightforward and simple:
Settings
Features
Fully Customizable
Indicator on Diffrent Assets
INDEX:BTCUSD 1D Chart (6 high 56 27 60/45 14)

CRYPTO:SOLUSD 1D Chart (24 open 31 20 60/40 14)

CRYPTO:RUNEUSD 1D Chart (10 close 56 14 60/40 14)

Remember no indicator would on all assets with default setting so FAFO with setting to get your desired signal.
The Dema Percentile Standard Deviation indicator is a robust tool designed to identify and follow trends in financial markets.
How it works?
This code is straightforward and simple:
- The price is smoothed using a DEMA (Double Exponential Moving Average).
- Percentiles are then calculated on that DEMA.
- When the closing price is below the lower percentile, it signals a potential short.
- When the closing price is above the upper percentile and the Standard Deviation of the lower percentile, it signals a potential long.
Settings
- Dema/Percentile/SD/EMA Length's: Defines the period over which calculations are made.
- Dema Source: The source of the price data used in calculations.
- Percentiles: Selects the type of percentile used in calculations (options include 60/40, 60/45, 55/40, 55/45). In these settings, 60 and 55 determine percentile for long signals, while 45 and 40 determine percentile for short signals.
Features
Fully Customizable
- Fully Customizable: Customize colors to display for long/short signals.
- Display Options: Choose to show long/short signals as a background color, as a line on price action, or as trend momentum in a separate window.
- EMA for Confluence: An EMA can be used for early entries/exits for added signal confirmation, but it may introduce noise—use with caution!
- Built-in Alerts.
Indicator on Diffrent Assets
INDEX:BTCUSD 1D Chart (6 high 56 27 60/45 14)
CRYPTO:SOLUSD 1D Chart (24 open 31 20 60/40 14)
CRYPTO:RUNEUSD 1D Chart (10 close 56 14 60/40 14)
Remember no indicator would on all assets with default setting so FAFO with setting to get your desired signal.
Информация о релизе
-Updated to PineScript 6Информация о релизе
-Added Option to Use Ema when detecting trendИнформация о релизе
-Fixed Bug with Plot/AlertsИнформация о релизе
- Default setting updated to more universal one's- Slight Ui change
Скрипт с открытым кодом
В истинном духе TradingView, создатель этого скрипта сделал его открытым исходным кодом, чтобы трейдеры могли проверить и убедиться в его функциональности. Браво автору! Вы можете использовать его бесплатно, но помните, что перепубликация кода подчиняется нашим Правилам поведения.
Отказ от ответственности
Информация и публикации не предназначены для предоставления и не являются финансовыми, инвестиционными, торговыми или другими видами советов или рекомендаций, предоставленных или одобренных TradingView. Подробнее читайте в Условиях использования.