OPEN-SOURCE SCRIPT
Обновлено Implied Leverage Ratio Between Current Symbol and BTC

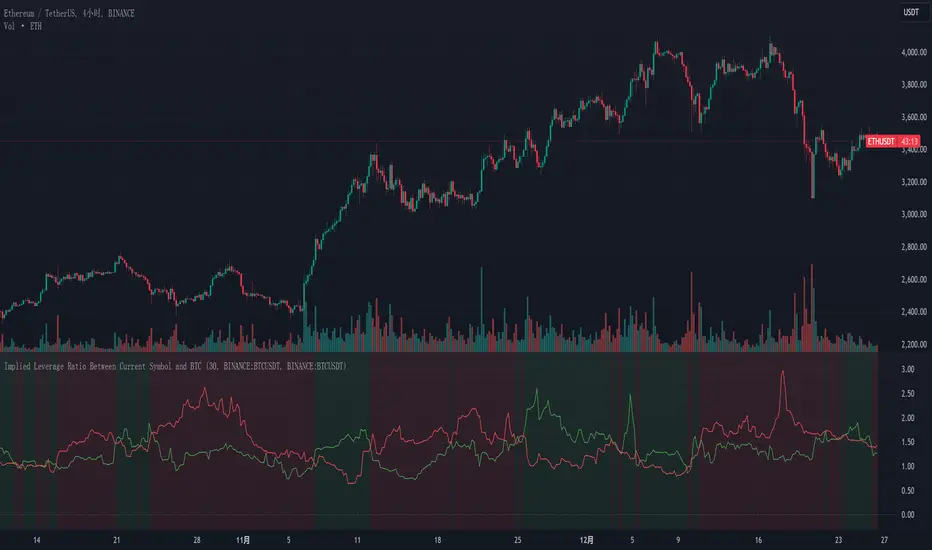
This script calculates and visualizes the implied leverage ratio between the current symbol and Bitcoin (BTC). The implied leverage ratio is computed by comparing the cumulative price changes of the two symbols over a defined number of candles. The results provide insights into how the current symbol performs relative to BTC in terms of bullish (upward) and bearish (downward) movements.
Features
How to Use
Who Can Benefit
This tool is particularly useful for identifying potential outperformers or underperformers relative to Bitcoin and can guide strategic decisions in trading pairs or market analysis.
Features
- Cumulative Up and Down Ratios:
The script calculates the cumulative price increase (up) and decrease (down) ratios for both the current symbol and BTC. These ratios are based on the percentage changes relative to each candle's opening price. - Implied Leverage Ratio:
For bullish movements, the cumulative up ratio of the current symbol is divided by BTC's cumulative up ratio.
For bearish movements, the cumulative down ratio of the current symbol is divided by BTC's cumulative down ratio.
These values reflect the implied leverage of the current symbol relative to BTC in both directions. - Customizable Comparison Symbol:
By default, the script compares the current symbol to BINANCE:BTCUSDT. However, you can specify any other symbol to tailor the analysis. - Interactive Visualization:
- Green Line: Represents the ratio of cumulative up movements (current symbol vs. BTC).
- Red Line: Represents the ratio of cumulative down movements (current symbol vs. BTC).
- A horizontal zero line is included for reference, ensuring the chart always starts from zero.
- Green Line: Represents the ratio of cumulative up movements (current symbol vs. BTC).
How to Use
- Add this script to your chart from the Pine Editor or the public library.
- Customize the number of candles (t) to define the period over which cumulative changes are calculated.
- If desired, replace the comparison symbol with another asset in the input settings.
- Analyze the green and red lines to identify relative strength and implied leverage trends.
Who Can Benefit
- Traders and Analysts: Gain insights into the relative performance of altcoins, stocks, or other instruments against BTC.
- Leverage Seekers: Identify assets with higher or lower implied leverage compared to Bitcoin.
- Market Comparisons: Understand how various assets react to market movements relative to BTC.
This tool is particularly useful for identifying potential outperformers or underperformers relative to Bitcoin and can guide strategic decisions in trading pairs or market analysis.
Информация о релизе
**Implied Leverage Ratio Between Current Symbol and BTC**This script calculates and visualizes the **implied leverage ratio** between the current symbol and Bitcoin (BTC). The ratio compares the cumulative price changes of the two symbols over a defined number of candles, providing insights into the relative strength of the current symbol in bullish and bearish movements.
---
### Features
1. **Cumulative Up and Down Ratios**:
- Calculates cumulative price increases (up) and decreases (down) for both the current symbol and BTC, based on percentage changes relative to each candle's opening price.
2. **Implied Leverage Ratio**:
- For bullish movements: the current symbol's cumulative up ratio divided by BTC's cumulative up ratio.
- For bearish movements: the current symbol's cumulative down ratio divided by BTC's cumulative
Скрипт с открытым кодом
В истинном духе TradingView, создатель этого скрипта сделал его открытым исходным кодом, чтобы трейдеры могли проверить и убедиться в его функциональности. Браво автору! Вы можете использовать его бесплатно, но помните, что перепубликация кода подчиняется нашим Правилам поведения.
Отказ от ответственности
Информация и публикации не предназначены для предоставления и не являются финансовыми, инвестиционными, торговыми или другими видами советов или рекомендаций, предоставленных или одобренных TradingView. Подробнее читайте в Условиях использования.