OPEN-SOURCE SCRIPT
Stock Comparison to S&P 500
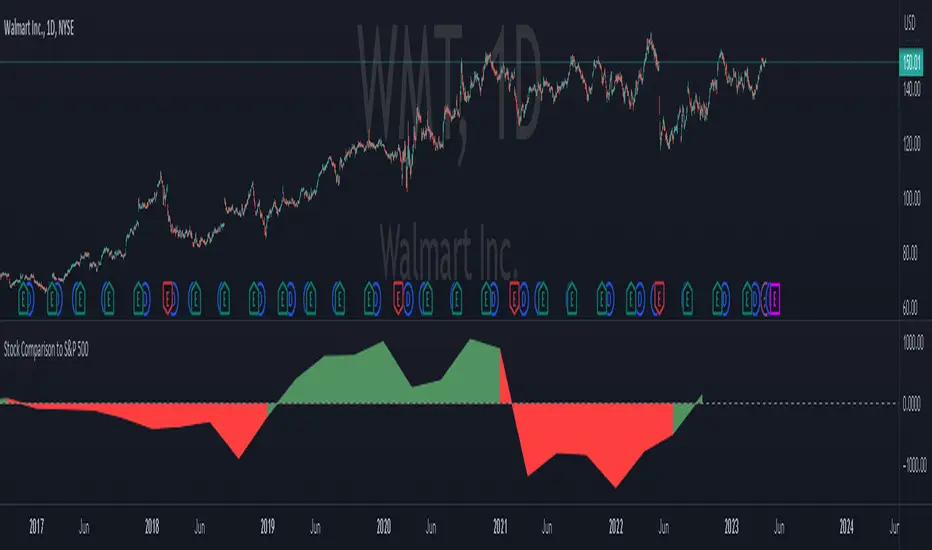
This indicator, "Stock Comparison to S&P 500," is designed to help traders compare the financial health and valuation of a chosen stock to the S&P 500 index. It compares several key financial metrics of the stock to the corresponding metrics of the S&P 500, including earnings growth, price-to-earnings ratio, price-to-book ratio, and price-to-sales ratio.
The indicator calculates the differences between each metric of the selected stock and the S&P 500, and then weights them using a formula that takes into account the importance of each metric. The resulting value represents the overall comparison between the stock and the S&P 500.
The indicator also displays the differences between the individual metrics in separate plots, allowing traders to see how each metric contributes to the overall comparison. Additionally, it colors the plots green if the selected stock is performing better than the S&P 500 in a particular metric and red if it's performing worse.
Traders can use this indicator to gain insight into the relative financial health and valuation of a selected stock compared to the S&P 500 index, which can help inform their trading decisions.
Скрипт с открытым кодом
В истинном духе TradingView, создатель этого скрипта сделал его открытым исходным кодом, чтобы трейдеры могли проверить и убедиться в его функциональности. Браво автору! Вы можете использовать его бесплатно, но помните, что перепубликация кода подчиняется нашим Правилам поведения.
Отказ от ответственности
Информация и публикации не предназначены для предоставления и не являются финансовыми, инвестиционными, торговыми или другими видами советов или рекомендаций, предоставленных или одобренных TradingView. Подробнее читайте в Условиях использования.