OPEN-SOURCE SCRIPT
Обновлено FACTOR MONITOR
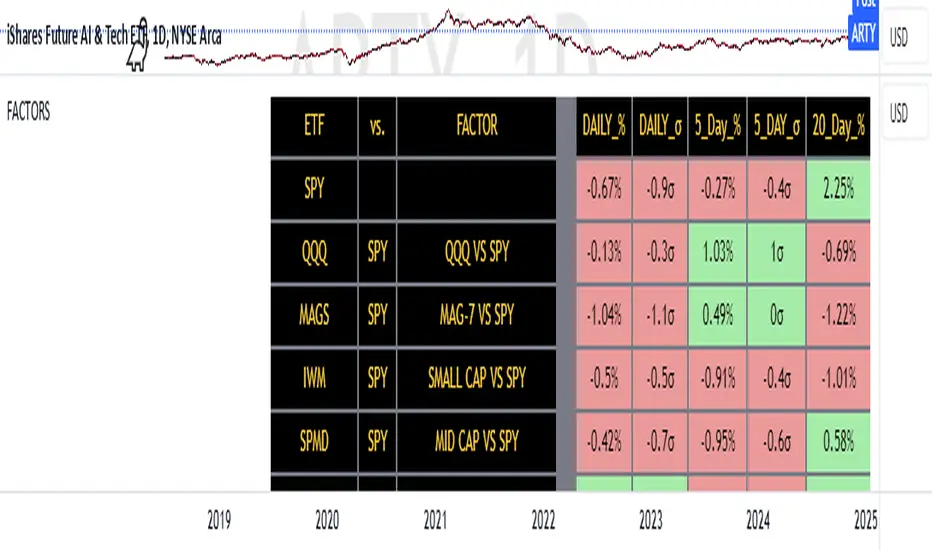
The Factor Monitor is a comprehensive designed to track relative strength and standard deviation movements across multiple market segments and investment factors. The indicator calculates and displays normalized percentage moves and their statistical significance (measured in standard deviations) across daily, 5-day, and 20-day periods, providing a multi-timeframe view of market dynamics.
Key Features:
Real-time tracking of relative performance between various ETF pairs (e.g., QQQ vs SPY, IWM vs SPY)
Standard deviation scoring system that identifies statistically significant moves
Color-coded visualization (green/red) for quick interpretation of relative strength
Multiple timeframe analysis (1-day, 5-day, and 20-day moves)
Monitoring of key market segments:
Style factors (Value, Growth, Momentum)
Market cap segments (Large, Mid, Small)
Sector relative strength
Risk factors (High Beta vs Low Volatility)
Credit conditions (High Yield vs Investment Grade)
The tool is particularly valuable for:
Identifying significant factor rotations in the market
Assessing market breadth through relative strength comparisons
Spotting potential trend changes through statistical deviation analysis
Monitoring sector leadership and market regime shifts
Quantifying the magnitude of market moves relative to historical norms
Информация о релизе
Just changed colors around to make more readableИнформация о релизе
Updated MAGS exchangeСкрипт с открытым кодом
В истинном духе TradingView, создатель этого скрипта сделал его открытым исходным кодом, чтобы трейдеры могли проверить и убедиться в его функциональности. Браво автору! Вы можете использовать его бесплатно, но помните, что перепубликация кода подчиняется нашим Правилам поведения.
Отказ от ответственности
Информация и публикации не предназначены для предоставления и не являются финансовыми, инвестиционными, торговыми или другими видами советов или рекомендаций, предоставленных или одобренных TradingView. Подробнее читайте в Условиях использования.
Скрипт с открытым кодом
В истинном духе TradingView, создатель этого скрипта сделал его открытым исходным кодом, чтобы трейдеры могли проверить и убедиться в его функциональности. Браво автору! Вы можете использовать его бесплатно, но помните, что перепубликация кода подчиняется нашим Правилам поведения.
Отказ от ответственности
Информация и публикации не предназначены для предоставления и не являются финансовыми, инвестиционными, торговыми или другими видами советов или рекомендаций, предоставленных или одобренных TradingView. Подробнее читайте в Условиях использования.