OPEN-SOURCE SCRIPT
Combo Backtest 123 Detrended Price Oscillator
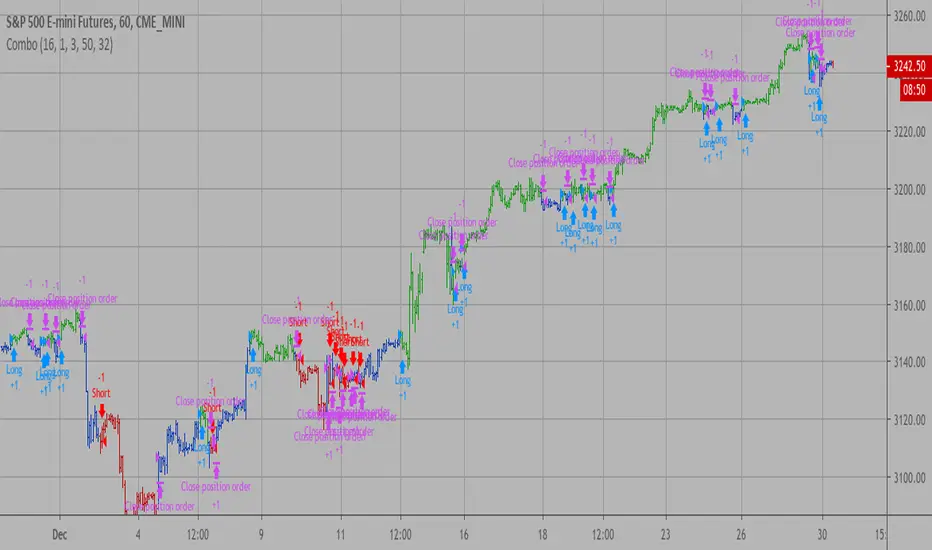
This is combo strategies for get a cumulative signal.
First strategy
This System was created from the Book "How I Tripled My Money In The
Futures Market" by Ulf Jensen, Page 183. This is reverse type of strategies.
The strategy buys at market, if close price is higher than the previous close
during 2 days and the meaning of 9-days Stochastic Slow Oscillator is lower than 50.
The strategy sells at market, if close price is lower than the previous close price
during 2 days and the meaning of 9-days Stochastic Fast Oscillator is higher than 50.
Second strategy
The Detrend Price Osc indicator is similar to a moving average,
in that it filters out trends in prices to more easily identify
cycles. The indicator is an attempt to define cycles in a trend
by drawing a moving average as a horizontal straight line and
placing prices along the line according to their relation to a
moving average. It provides a means of identifying underlying
cycles not apparent when the moving average is viewed within a
price chart. Cycles of a longer duration than the Length (number
of bars used to calculate the Detrend Price Osc) are effectively
filtered or removed by the oscillator.
WARNING:
- For purpose educate only
- This script to change bars colors.
Скрипт с открытым кодом
В истинном духе TradingView, создатель этого скрипта сделал его открытым исходным кодом, чтобы трейдеры могли проверить и убедиться в его функциональности. Браво автору! Вы можете использовать его бесплатно, но помните, что перепубликация кода подчиняется нашим Правилам поведения.
Отказ от ответственности
Информация и публикации не предназначены для предоставления и не являются финансовыми, инвестиционными, торговыми или другими видами советов или рекомендаций, предоставленных или одобренных TradingView. Подробнее читайте в Условиях использования.