PROTECTED SOURCE SCRIPT
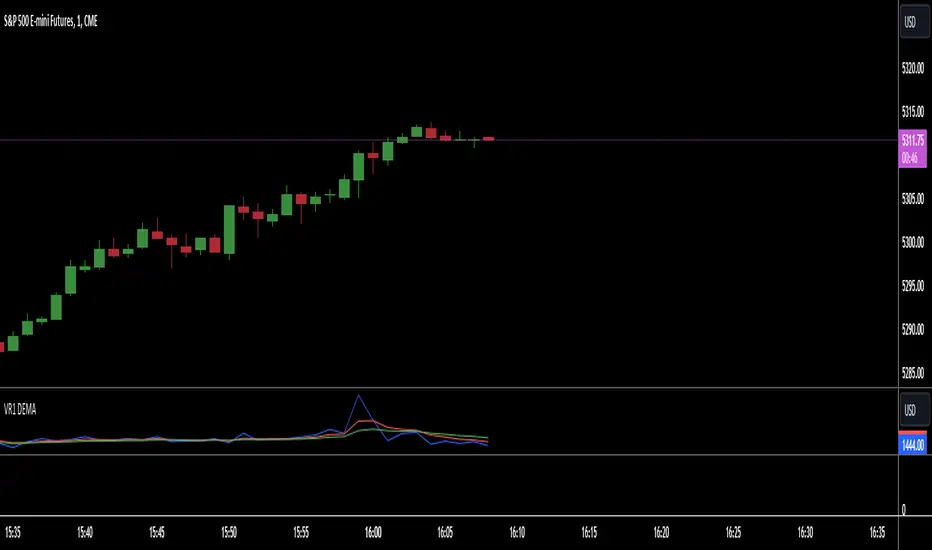
VR1 DEMA

Sure, here's a description for the "Volume Range Dual EMA" indicator:
---
**Indicator Name:** Volume Range Dual EMA
**Description:**
The "Volume Range Dual EMA" indicator is a technical analysis tool designed for TradingView charts. It calculates the ratio of volume to the price range of each bar and plots two Exponential Moving Averages (EMAs) of this ratio.
**Usage:**
- This indicator helps traders analyze the relationship between volume and price range in a given timeframe.
- The primary purpose of the indicator is to identify trends and potential changes in market sentiment based on volume and price movements.
- Traders can adjust the lengths of the EMAs according to their trading strategies and preferences.
- When the shorter EMA crosses above the longer EMA, it may signal a bullish trend, whereas a crossover in the opposite direction could indicate a bearish trend.
**Parameters:**
1. **EMA Length 1:** Defines the length of the first Exponential Moving Average (EMA) used in the calculation.
2. **EMA Length 2:** Defines the length of the second Exponential Moving Average (EMA) used in the calculation.
Скрипт с защищённым кодом
Этот скрипт опубликован с закрытым исходным кодом. Однако вы можете использовать его свободно и без каких-либо ограничений — читайте подробнее здесь.
Отказ от ответственности
Все виды контента, которые вы можете увидеть на TradingView, не являются финансовыми, инвестиционными, торговыми или любыми другими рекомендациями. Мы не предоставляем советы по покупке и продаже активов. Подробнее — в Условиях использования TradingView.