OPEN-SOURCE SCRIPT
VXN Williams %R
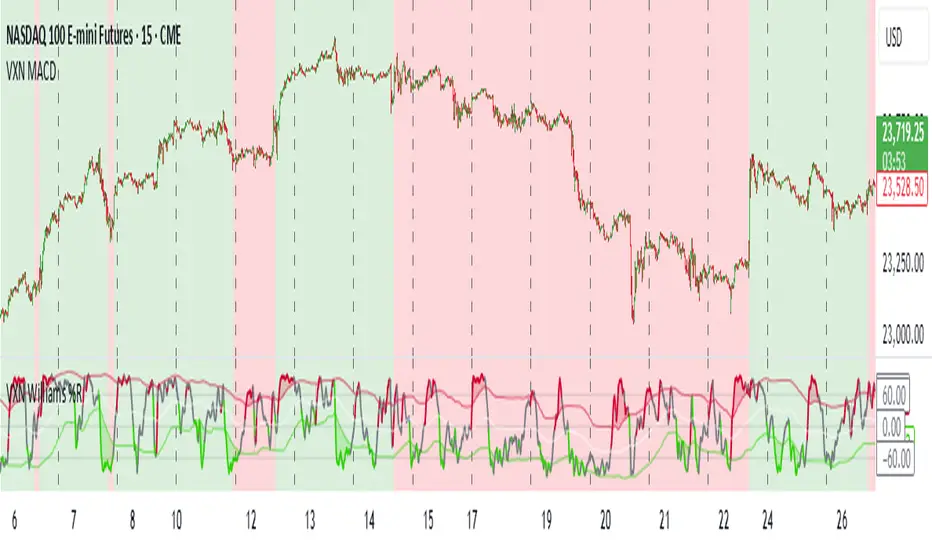
This indicator is based on other open source scripts. It's designed for trading NASDAQ futures using the Williams %R oscillator combined with Bollinger Bands.
The Williams %R is calculated based on a user-defined source and period, then smoothed with a moving average (SMA, EMA, WMA, or RMA).
Bollinger Bands are applied to the scaled Williams %R to identify overbought and oversold conditions.
The background color reflects the trend of the VXN (CBOE NASDAQ Volatility Index):
- Green background: Indicates a bullish trend (VXN EMA < VXN SMA), suggesting long entries at green peaks (Williams %R crossing above the upper Bollinger Band).
- Red background: Indicates a bearish trend (VXN EMA > VXN SMA), suggesting short entries at red peaks (Williams %R crossing below the lower Bollinger Band).
Скрипт с открытым кодом
В истинном духе TradingView автор этого скрипта опубликовал его с открытым исходным кодом, чтобы трейдеры могли понять, как он работает, и проверить на практике. Вы можете воспользоваться им бесплатно, но повторное использование этого кода в публикации регулируется Правилами поведения.
Отказ от ответственности
Все виды контента, которые вы можете увидеть на TradingView, не являются финансовыми, инвестиционными, торговыми или любыми другими рекомендациями. Мы не предоставляем советы по покупке и продаже активов. Подробнее — в Условиях использования TradingView.