OPEN-SOURCE SCRIPT
[OCT] Moving Average Sigmoid Variance

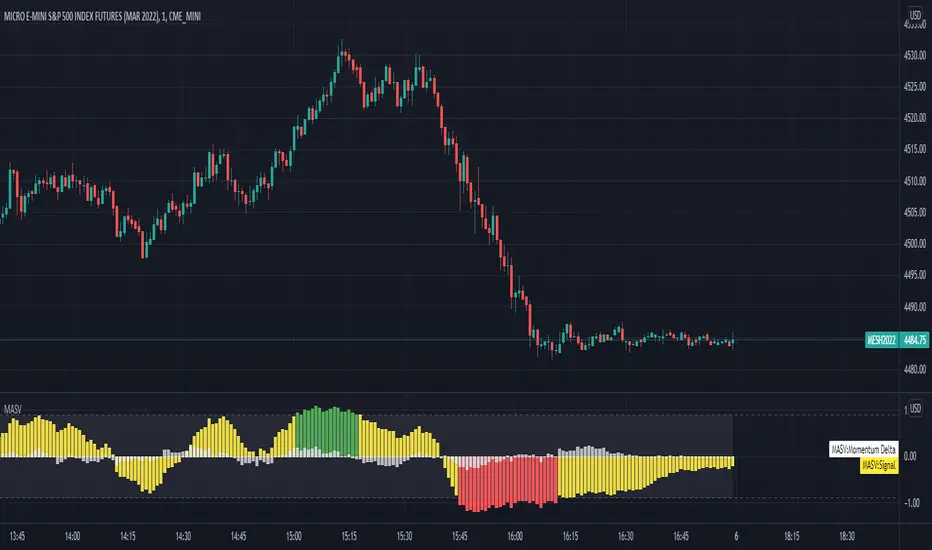
Uses a weighted sigmoid function to gauge the difference between two moving averages. Useful as an additional confirmation source for following trends.
The signal line hovers between -1 and 1, -1 being a negative delta and 1 being a positive delta.
Using a minimum and maximum threshold, a trend can be identified based on how far the signal line crosses the thresholds.
The signal is optionally (enabled by default) adjusted by a "momentum", which is calculated as a moving average of the *change* of a value over time. It's a bit finicky to describe, so please take a look at how it's calculated in code if you wish to use it.
The signal, by default, is green when the value is above the threshold, red when it's below the threshold, and yellow when inside the threshold.
NOTE:
This study is extremely untuned and should not be used as the sole inspiration for taking or exiting a position out of the box.
Please play around with the many available configuration options to fine tune the output to fit your personal strategy.
Configurable options:
- All colors
- All moving average algorithms
- All moving average sources
- All moving average lengths
- Threshold values
- Signal and momentum multipliers
- Whether or not to use the momentum
- Whether or not to plot the momentum
Скрипт с открытым кодом
В истинном духе TradingView, создатель этого скрипта сделал его открытым исходным кодом, чтобы трейдеры могли проверить и убедиться в его функциональности. Браво автору! Вы можете использовать его бесплатно, но помните, что перепубликация кода подчиняется нашим Правилам поведения.
Отказ от ответственности
Информация и публикации не предназначены для предоставления и не являются финансовыми, инвестиционными, торговыми или другими видами советов или рекомендаций, предоставленных или одобренных TradingView. Подробнее читайте в Условиях использования.