OPEN-SOURCE SCRIPT
Обновлено Pragmatic risk management
INTRO
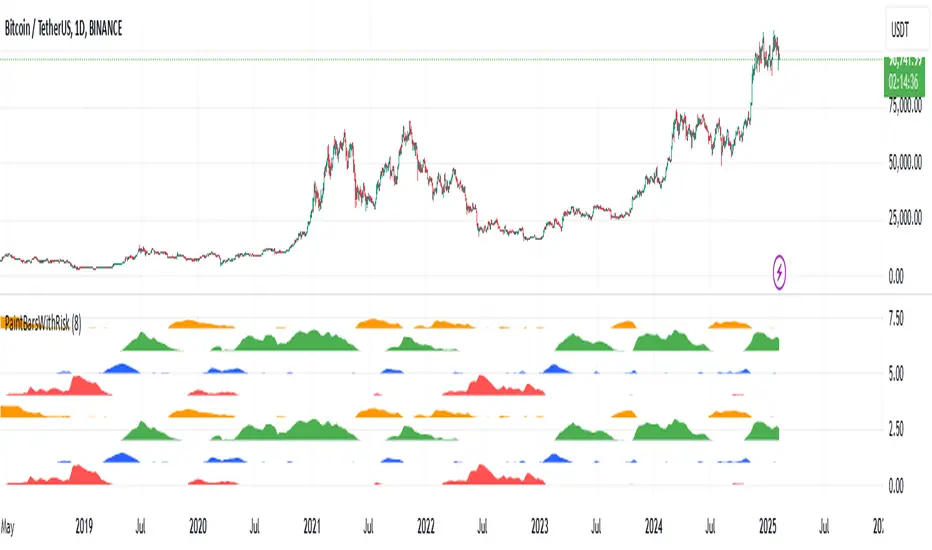
The indicator is calculating multiple moving averages on the value of price change %. It then combines the normalized (via arctan function) values into a single normalized value (via simple average).
The total error from the center of gravity and the angle in which the error is accumulating represented by 4 waves:
BLUE = Good for chance for price to go up
GREEN = Good chance for price to continue going up
ORANGE = Good chance for price to go down
RED = Good chance for price to continue going down
A full cycle of ORANGE\RED\BLUE\GREEN colors will ideally lead to the exact same cycle, if not, try to understand why.
NOTICE-
This indicator is calculating large time-windows so It can be heavy on your device. Tested on PC browser only.
My visual setup:
1. Add two indicators on-top of each other and merge their scales (It will help out later).
2. Zoom out price chart to see the maximum possible data.
3. Set different colors for both indicators for simple visual seperation.
4. Choose 2 different values, one as high as possible and one as low as possible.
(Possible - the indicator remains effective at distinguishing the cycle).
Manual calibration:
0. Select a fixed chart resolution (2H resolution minimum recommended).
1. Change the "mul2" parameter in ranges between 4-15 .
2. Observe the "Turning points" of price movement. (Typically when RED\GREEN are about to switch.)
2. Perform a segmentation of time slices and find cycles. No need to be exact!
3. Draw a square on price movement at place and color as the dominant wave currently inside the indicator.
This procedure should lead to a full price segmentation with easier anchoring.
Информация о релизе
Change bar color based on most dominant wave.Информация о релизе
Update script to V5Информация о релизе
Added a clone of the bottom 4 waves above the previous 4 waves to emphasize that it doesn't matter which color is the "top" and which color is the "bottom". You can start your analysis from any color and move up\downСкрипт с открытым кодом
В истинном духе TradingView, создатель этого скрипта сделал его открытым исходным кодом, чтобы трейдеры могли проверить и убедиться в его функциональности. Браво автору! Вы можете использовать его бесплатно, но помните, что перепубликация кода подчиняется нашим Правилам поведения.
Отказ от ответственности
Информация и публикации не предназначены для предоставления и не являются финансовыми, инвестиционными, торговыми или другими видами советов или рекомендаций, предоставленных или одобренных TradingView. Подробнее читайте в Условиях использования.
Скрипт с открытым кодом
В истинном духе TradingView, создатель этого скрипта сделал его открытым исходным кодом, чтобы трейдеры могли проверить и убедиться в его функциональности. Браво автору! Вы можете использовать его бесплатно, но помните, что перепубликация кода подчиняется нашим Правилам поведения.
Отказ от ответственности
Информация и публикации не предназначены для предоставления и не являются финансовыми, инвестиционными, торговыми или другими видами советов или рекомендаций, предоставленных или одобренных TradingView. Подробнее читайте в Условиях использования.