OPEN-SOURCE SCRIPT
Обновлено PE Band

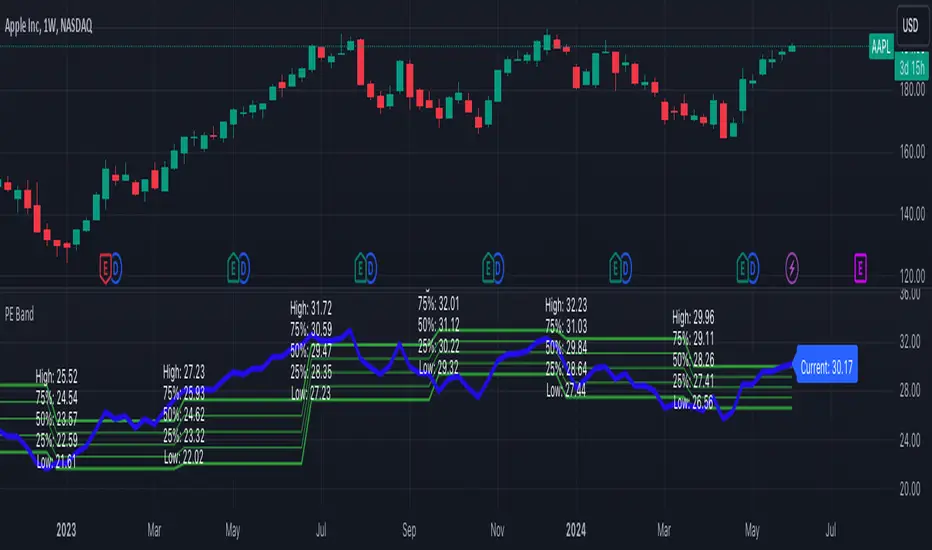
The PE Band shows the highest and lowest P/E in the previous period with TTM EPS. If the current P/E is lower than the minimum P/E, it is considered cheap. In other words, higher than the maximum P/E is considered expensive.
PE Band consists of 2 lines.
- Firstly, the historical P/E value in "green" (if TTM EPS is positive) or "red" (if TTM EPS is negative) states will change according to the latest high or low price of TTM EPS, such as: :
After the second quarter of 2023 (end of June), how do prices from 1 July – 30 September reflect net profits? The program will get the highest and lowest prices during that time.
After the 3rd quarter of 2023 (end of September), how do prices from 1 Oct. - 31 Dec. reflect net profits? The program will get the highest and lowest prices during that time.
- Second, the blue line is the closing price divided by TTM EPS, which shows the current P/E.
Информация о релизе
1. Change from "EARNINGS_PER_SHARE" to "EARNINGS_PER_SHARE_DILUTED"2. Add more lines of 75% P/E and 25% P/E
Информация о релизе
to solve Error on bar 5000 as comment - Add attribute "calc_bars_count = 5000" in indicator
Скрипт с открытым кодом
В истинном духе TradingView, создатель этого скрипта сделал его открытым исходным кодом, чтобы трейдеры могли проверить и убедиться в его функциональности. Браво автору! Вы можете использовать его бесплатно, но помните, что перепубликация кода подчиняется нашим Правилам поведения.
Отказ от ответственности
Информация и публикации не предназначены для предоставления и не являются финансовыми, инвестиционными, торговыми или другими видами советов или рекомендаций, предоставленных или одобренных TradingView. Подробнее читайте в Условиях использования.