OPEN-SOURCE SCRIPT
Обновлено Length True Range BarColor

Overview
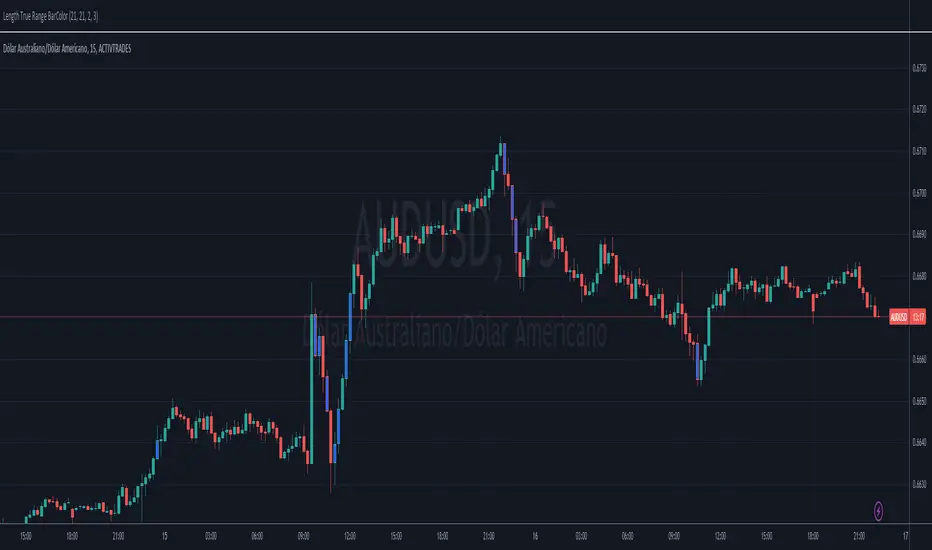
The indicator prints different colors on the candles for pre-determined amplitudes in relation to the simple moving average over the average true range.
Calculations
The indicated value of the simple moving average in relation to the average true range is being used to restrict the color of the candle signal to its pre-determined amplitude.
How It Works
Supposing you have a strategy where there is a need to determine the size of the acceptable signal bar in relation to the average true range, as well as size your stop and target through this range. In summary, coloring based on the size of the amplitude due to the average of the ATR, provides the ease of identifying weak signals, where there will possibly not be a sequence of movement, or identifying stretched signals where it will possibly provide a correction movement. This way you can determine an ideal size range for your input signal. Ex: Color candle signal with size of ( Candle => 2* the SMA (ATR) and <= 3* the SMA (ATR).
Inputs
Valores
Period: To determine the length of the ATR
SMA: To determine the length of the Simple Moving Average
LengthMin: Minimum amplitude size factor
LengthMax: Maximum amplitude size factor
Traço: Coloring ATR
SMA: Coloring SMA
Traço: Coloring TR
Bar Color: Coloring candle Sing
Note 1
The values of ATR, SMA and TR will normally be shown in the indicator header for a dynamic visualization of the values, and possible exceptions for candles signals outside the initially proposed factor can be compared.
Note 2
Codes made available in the PINE language reference manual were used to develop the indicator, therefore it is a practical code for trend following setup strategies not available in the community.
Информация о релизе
Update ATR input nameИнформация о релизе
Update ATR line nameИнформация о релизе
Update candle amplitude line nameИнформация о релизе
ImagemИнформация о релизе
change in caption >= que: length Max to <= que: length MaxСкрипт с открытым кодом
В истинном духе TradingView, создатель этого скрипта сделал его открытым исходным кодом, чтобы трейдеры могли проверить и убедиться в его функциональности. Браво автору! Вы можете использовать его бесплатно, но помните, что перепубликация кода подчиняется нашим Правилам поведения.
Отказ от ответственности
Информация и публикации не предназначены для предоставления и не являются финансовыми, инвестиционными, торговыми или другими видами советов или рекомендаций, предоставленных или одобренных TradingView. Подробнее читайте в Условиях использования.
Скрипт с открытым кодом
В истинном духе TradingView, создатель этого скрипта сделал его открытым исходным кодом, чтобы трейдеры могли проверить и убедиться в его функциональности. Браво автору! Вы можете использовать его бесплатно, но помните, что перепубликация кода подчиняется нашим Правилам поведения.
Отказ от ответственности
Информация и публикации не предназначены для предоставления и не являются финансовыми, инвестиционными, торговыми или другими видами советов или рекомендаций, предоставленных или одобренных TradingView. Подробнее читайте в Условиях использования.