OPEN-SOURCE SCRIPT
Relative Strength Daily/Weekly
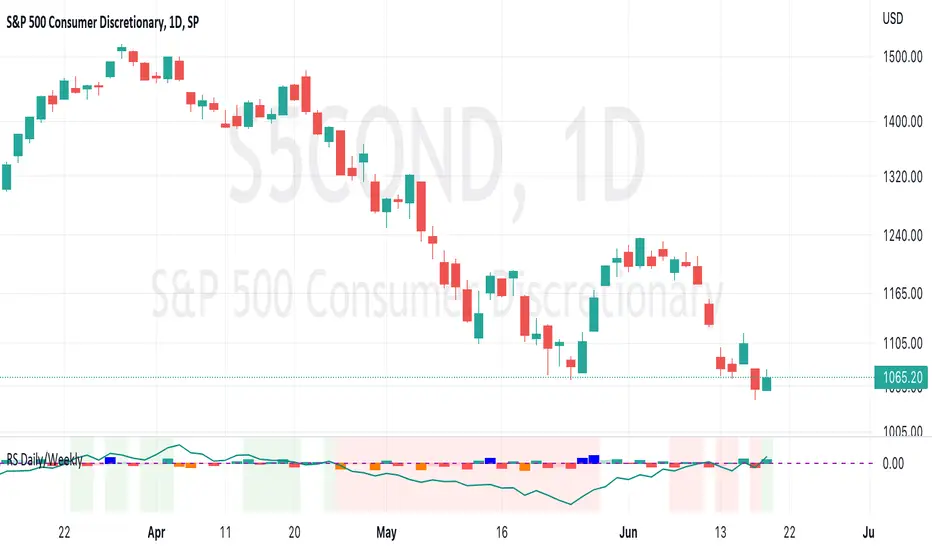
This script measures and plots the movement of the current ticker against a reference ticker. It can be used on any timeframe, however the default values are designed around the Daily timeframe.
The columns show the relative strength or weakness of the current ticker against the reference for the single candle it lies under.
If the current ticker is showing relative strength on any particular day, the column will be either green or blue. The default colour is light green but if the ticker is showing more relative strength than the previous day, the column will be dark green. The column will be blue when the ticker is showing the highest level of relative strength when compared to the previous 21 candles.
If the ticker is showing relative weakness on any particular day, the column will either be red or orange. The default colour is light red but if the ticker is showing more relative weakness than the previous day, the column will be dark red. The column will be orange when the ticker is showing the highest level of relative weakness when compared to the previous 21 candles.
Relative strength is calculated by ((close - previous close)/previous close) - ((reference close - previous reference close)/previous reference close) * 1000
The multiplication by 1000 is simply to help the plot be more useful visually.
The line plots the same calculation but compares the current closes against their respective closes 21 candles earlier.
If the the current ticker is showing relative strength when referenced against the closes 5 bars earlier and when referenced against the closes 21 bars earlier, the background will shade green. If the current ticker shows relative weakness across those same conditions, the background will shade red.
Скрипт с открытым кодом
В истинном духе TradingView, создатель этого скрипта сделал его открытым исходным кодом, чтобы трейдеры могли проверить и убедиться в его функциональности. Браво автору! Вы можете использовать его бесплатно, но помните, что перепубликация кода подчиняется нашим Правилам поведения.
Отказ от ответственности
Информация и публикации не предназначены для предоставления и не являются финансовыми, инвестиционными, торговыми или другими видами советов или рекомендаций, предоставленных или одобренных TradingView. Подробнее читайте в Условиях использования.