Gann Angles Enterprise
The Gann methods and those of his followers are based on representing price movements as geometric shapes such as triangles, squares, and circles. Gann believed that price movements adhere to certain patterns and that future changes can be predicted based on these geometric forms.
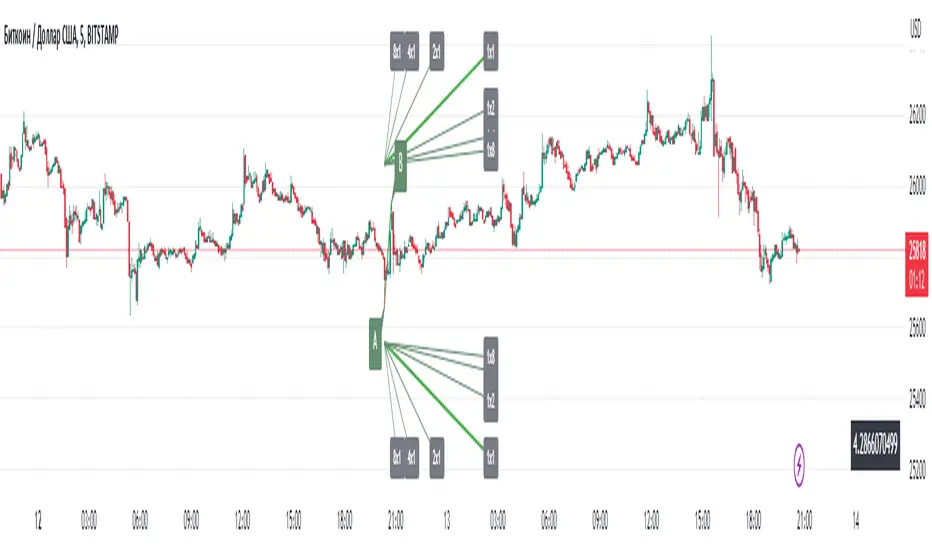
The Gann Angle indicator allows users to identify the angles of trend and their strength. It plots template lines with different angles of inclination on the price chart, representing support and resistance levels. These levels can be used to determine entry and exit points in the market, as well as to set stop-loss and profit levels.
When automatically calculating the angle scale, the indicator takes into account various factors such as the current trend, market volatility, and the period of analyzed data. It applies relevant formulas and algorithms to determine optimal angles of inclination and create a fan-like pattern of angles.
However, the indicator also provides the option for users to manually input their own angle scale. This allows analysts or traders to customize the indicator according to their own preferences and strategies.
Overall, the Gann Angle indicator is a powerful tool for technical analysis in financial markets. It helps identify key support and resistance levels and provides information about the trend and its strength. Combining the automatic calculation of the angle scale with the option to input a manual scale gives users flexibility and adaptability in using the indicator. They can consider their own preferences, experience, and unique market conditions when determining angles of inclination and support/resistance levels.
It is important to note that the effectiveness of the Gann Angle indicator, whether using an automatic or manual scale, depends on proper analysis and interpretation of the results. Users should have knowledge and understanding of Gann's methods to make informed decisions based on the data provided by the indicator.
In conclusion, the Gann Angle indicator with automatic and manual angle scale calculation provides users with a powerful tool for analyzing and forecasting price movements in financial markets. It combines the fundamental principles of William Delbert Gann's methods with flexibility and customization to meet the needs of various traders and analysts.
The different methods of calculating the scale give traders the flexibility to choose the follower's school they prefer.
The features of the indicator include:
Mandatory knowledge of Gann's methods.
Use as a template for drawing angles and fan patterns.
Selection of scale calculation options:
Heliker
Herzhik
Gann
Borovski
Manual input of the scale
Working principle:
The indicator is used as a template.
After installing the indicator and configuring it, the trader needs to draw a trend line (or a pre-drawn fan) along the desired angle(s).
Without changing the inclination, the trader simply moves this line to the desired extreme for further analysis.
1) Optimized script code
2) Added new type of calculation of angles (AB 4x1) The principle of this method is that the first pulse is always taken as a 4x1 angle.
3) Added auto set selection.
4) Added experimental function - calculation of angles in logarithmic scale.
-Introduced full automatic selection of high-low peak points depending on the selected scale methodology
It is considered the ideal balance between time and price.
The Gann Square method is the quintessence of geometry, where √2 serves as a universal coefficient linking time and price. It has been and remains a powerful tool for forecasting market movements.
Скрипт с ограниченным доступом
Только пользователи, одобренные автором, могут получить доступ к этому скрипту. Вам нужно отправить запрос и получить разрешение на его использование. Обычно доступ предоставляется после оплаты. Для получения подробной информации следуйте инструкциям автора ниже или свяжитесь с ganntradings напрямую.
TradingView НЕ рекомендует платить за скрипт или использовать его, если вы не доверяете его автору и не понимаете, как скрипт работает. Вы всегда можете найти бесплатные скрипты с открытым исходным кодом в Скриптах сообщества.
Инструкции от автора
RU:
Не решайте за цену, куда ей идти,
дайте ей возможность самой проявить себя и подтвердить
W.D.Gann
Отказ от ответственности
Скрипт с ограниченным доступом
Только пользователи, одобренные автором, могут получить доступ к этому скрипту. Вам нужно отправить запрос и получить разрешение на его использование. Обычно доступ предоставляется после оплаты. Для получения подробной информации следуйте инструкциям автора ниже или свяжитесь с ganntradings напрямую.
TradingView НЕ рекомендует платить за скрипт или использовать его, если вы не доверяете его автору и не понимаете, как скрипт работает. Вы всегда можете найти бесплатные скрипты с открытым исходным кодом в Скриптах сообщества.
Инструкции от автора
RU:
Не решайте за цену, куда ей идти,
дайте ей возможность самой проявить себя и подтвердить
W.D.Gann