OPEN-SOURCE SCRIPT
Обновлено Plot Level on Threshold Exceed
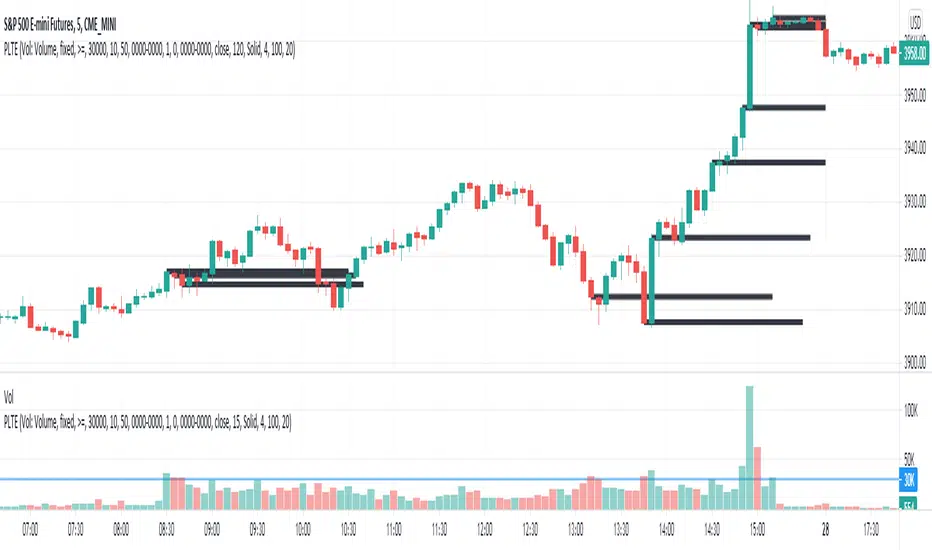
This script plots a line for X minutes, when the given reference source (which could be another indicator like volume, etc), exceeds the fixed value threshold.
There is a line limit in TV, so only the most recent 40 lines are plotted
There is a line limit in TV, so only the most recent 40 lines are plotted
Информация о релизе
Added numerous other threshold types (sma, ema, wma, rma, swma, percentiles)Added custom comparator logic (<, <=, =, >, >=)
Added threshold multiplier
Added ability to plot threshold itself
Информация о релизе
Added in sample session filter (only include samples during desired session times)Added in percentiles and stddev/ma thresholds
Added in efficiencies for line management
Added in plotshape functionality
Информация о релизе
Threshold offset field added to prevent current bar influencing the threshold itself (if desired)Информация о релизе
Updated with additional capabilities for plotarrow and plotcharИнформация о релизе
Updated for cross-based comparatorsИнформация о релизе
Updated arrow logic to be in line with threshold break direction, or alternatively select to reverse this logic.Скрипт с открытым кодом
В истинном духе TradingView, создатель этого скрипта сделал его открытым исходным кодом, чтобы трейдеры могли проверить и убедиться в его функциональности. Браво автору! Вы можете использовать его бесплатно, но помните, что перепубликация кода подчиняется нашим Правилам поведения.
Отказ от ответственности
Информация и публикации не предназначены для предоставления и не являются финансовыми, инвестиционными, торговыми или другими видами советов или рекомендаций, предоставленных или одобренных TradingView. Подробнее читайте в Условиях использования.
Скрипт с открытым кодом
В истинном духе TradingView, создатель этого скрипта сделал его открытым исходным кодом, чтобы трейдеры могли проверить и убедиться в его функциональности. Браво автору! Вы можете использовать его бесплатно, но помните, что перепубликация кода подчиняется нашим Правилам поведения.
Отказ от ответственности
Информация и публикации не предназначены для предоставления и не являются финансовыми, инвестиционными, торговыми или другими видами советов или рекомендаций, предоставленных или одобренных TradingView. Подробнее читайте в Условиях использования.