yongyuth.rootwararit

Yuthavithi Kana with S/R Strategy

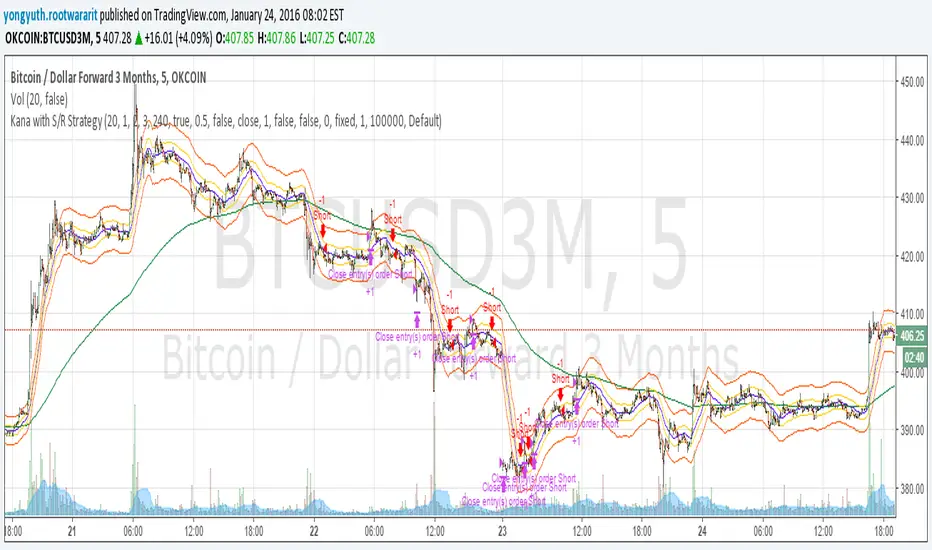
I have got the idea from this page iwongsakorn.com/tag/kana-scalper/ and wrote my own kana scalper. This strategy draws 3 200 ATR level along side with the sma. It uses 200 ema as trend. Once the price approaches the 20 ema. it will place orders according to trend and take profit and stop loss quickly using the 200 ATR lines.

This is a quick scalper strategy with winrate over 50%
Скрипт с открытым кодом

В истинном духе TradingView автор этого скрипта опубликовал его с открытым исходным кодом, чтобы трейдеры могли понять, как он работает, и проверить на практике. Вы можете воспользоваться им бесплатно, но повторное использование этого кода в публикации регулируется Правилами поведения. Вы можете добавить этот скрипт в избранное и использовать его на графике.

Отказ от ответственности

Все виды контента, которые вы можете увидеть на TradingView, не являются финансовыми, инвестиционными, торговыми или любыми другими рекомендациями. Мы не предоставляем советы по покупке и продаже активов. Подробнее — в Условиях использования TradingView.

Хотите использовать этот скрипт на графике?
//@version=2
strategy("Kana with S/R Strategy", title = "KANA with S/R", overlay=true)

len = input(20, minval=1, title="Length")
multiplier1 = input(1, minval=1, title="multiplier1")
multiplier2 = input(2, minval=1, title="multiplier2")
multiplier3 = input(3, minval=1, title="multiplier3") 
srTimeFrame = input(240, minval=1, title="Support Resistance TimeFrame")
useSR = input(true, type = bool, title="Use Support/Resistance")
tpPercent = input(0.5, type=float, title = "Take Profit Percent")
useTP = input(false, type=bool, title = "Use Take Profit")
tp = (close * tpPercent / 100) / syminfo.mintick

src = input(close, title="Source")
mid = sma(src, len)
plot(mid, title="SMA", color=blue)

trend = ema(close, 200)
plot(trend, title="Trend", color=green)


upper1 = mid + atr(200) * multiplier1
upper2 = mid + atr(200) * multiplier2
upper3 = mid + atr(200) * multiplier3

lower1 = mid - atr(200) * multiplier1
lower2 = mid - atr(200) * multiplier2
lower3 = mid - atr(200) * multiplier3

plot(upper1, color = orange)
plot(upper3, color = red)

plot(lower1, color = orange)
plot(lower3, color = red)

haClose = security(heikinashi(tickerid), period, close)
haOpen = security(heikinashi(tickerid), period, open)

resistance = security(tickerid,tostring(srTimeFrame), high)
support  = security(tickerid,tostring(srTimeFrame), low)
rsPos = (close - support[srTimeFrame]) / (resistance[srTimeFrame] - support[srTimeFrame])

MACD = ema(close, 120) - ema(close, 260)
aMACD = ema(MACD, 90)
hisline = MACD - aMACD

longCondition = (mid > trend) and (haOpen[1] < haClose[1]) and (mid > mid[1]) and (close < upper1) and hisline > 0 and (useSR == true ? (rsPos > 100) : true)
shortCondition = (mid < trend) and (haOpen[1] > haClose[1]) and (mid < mid[1]) and (close > lower1) and hisline < 0 and (useSR == true ? (rsPos < 0) : true)

longExit = (close > upper3 ) or (close < lower2)
shortExit = (close < lower3) or (close > upper2)

if (longCondition)
    strategy.entry("Long", strategy.long)
    if (useTP)
        strategy.exit("Exit Long", "Long", profit = tp)
        
if (longExit)
    strategy.close("Long")
    
if (shortCondition)
    strategy.entry("Short", strategy.short)
    if (useTP)
        strategy.exit("Exit Short", "Short", profit = tp)
    
if (shortExit)
    strategy.close("Short")