OPEN-SOURCE SCRIPT
Обновлено Gap Percentage Highlighter (1Day)
b]🇬🇧 ENGLISH
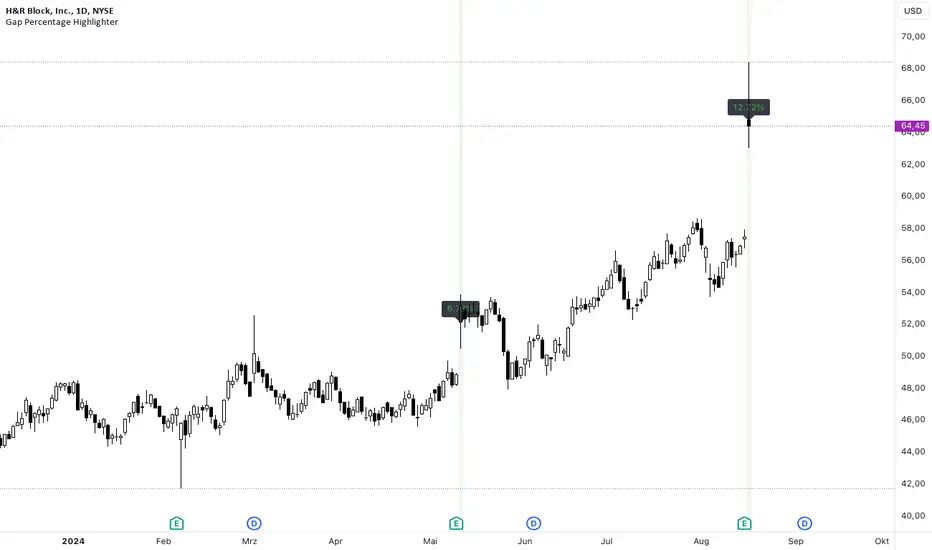
The "Gap Percentage Highlighter" script is a useful tool for traders who want to visually highlight and analyze price gaps on their charts.
Features:
Identification of Price Gaps (Gaps):
The script automatically highlights candles where the opening price significantly differs from the previous day's closing price.
Percentage Display of the Gap:
The percentage change between the closing price and the opening price is displayed directly on the chart.
Customizable Gap Size:
Users can set the minimum size of the price gap in percentage terms through a simple input field, determining when the script marks a gap as significant.
Visual Highlighting:
Gap-ups (positive gaps) are highlighted in green, and gap-downs (negative gaps) are highlighted in red, making them easy to identify.
Use Case:
This script is ideal for traders who utilize gaps in their analyses to identify potential market movements. It allows for quick and visual identification of significant price gaps directly on the chart and offers the flexibility to adjust the definition of "significant" to match individual needs.
Disclaimer:
This script is for educational purposes only. Trading involves risks and is not suitable for every investor.
(c) BS IMPACT SCALE GmbH
🇩🇪 GERMAN
Das "Gap Percentage Highlighter" Skript ist ein nützliches Tool für Trader, die Kurslücken (Gaps) auf ihren Charts visuell hervorheben und analysieren möchten.
Funktionen:
Identifizierung von Kurslücken (Gaps):
Das Skript hebt automatisch Kerzen hervor, bei denen der Eröffnungskurs vom Schlusskurs der vorherigen Kerze auf Tagesbasis signifikant abweicht.
Prozentuale Anzeige der Kurslücke:
Die prozentuale Veränderung zwischen Schlusskurs und Eröffnungskurs wird direkt auf dem Chart angezeigt.
Anpassbare Gap-Größe:
Nutzer können über ein einfaches Eingabefeld die minimale Größe der Kurslücke in Prozent festlegen, ab der das Skript die Lücke als relevant markiert.
Visuelle Hervorhebung:
Gap-Ups (positive Lücken) werden in Grün und Gap-Downs (negative Lücken) in Rot hinterlegt, sodass sie leicht identifiziert werden können.
Anwendungsbereich:
Dieses Skript ist ideal für Trader, die Gaps in ihren Analysen nutzen, um potenzielle Marktbewegungen zu identifizieren. Es ermöglicht eine schnelle und visuelle Erkennung von signifikanten Kurslücken direkt auf dem Chart und bietet die Flexibilität, die Definition von "signifikant" an die eigenen Bedürfnisse anzupassen.
Haftungsausschluss:
Dieses Skript dient ausschließlich zu Bildungszwecken. Trading beinhaltet Risiken und ist nicht für jeden Anleger geeignet.
(c) BS IMPACT SCALE GmbH
Информация о релизе
🇬🇧 ENGLISHThe "Gap Percentage Highlighter" script is a useful tool for traders who want to visually highlight and analyze price gaps on their charts.
Features:
Identification of Price Gaps (Gaps):
The script automatically highlights candles where the opening price significantly differs from the previous day's closing price.
Percentage Display of the Gap:
The percentage change between the closing price and the opening price is displayed directly on the chart.
Customizable Gap Size:
Users can set the minimum size of the price gap in percentage terms through a simple input field, determining when the script marks a gap as significant.
Visual Highlighting:
Gap-ups (positive gaps) are highlighted in green, and gap-downs (negative gaps) are highlighted in red, making them easy to identify.
Use Case:
This script is ideal for traders who utilize gaps in their analyses to identify potential market movements. It allows for quick and visual identification of significant price gaps directly on the chart and offers the flexibility to adjust the definition of "significant" to match individual needs.
Disclaimer:
This script is for educational purposes only. Trading involves risks and is not suitable for every investor.
(c) BS IMPACT SCALE GmbH
🇩🇪 GERMAN
Das "Gap Percentage Highlighter" Skript ist ein nützliches Tool für Trader, die Kurslücken (Gaps) auf ihren Charts visuell hervorheben und analysieren möchten.
Funktionen:
Identifizierung von Kurslücken (Gaps):
Das Skript hebt automatisch Kerzen hervor, bei denen der Eröffnungskurs vom Schlusskurs der vorherigen Kerze auf Tagesbasis signifikant abweicht.
Prozentuale Anzeige der Kurslücke:
Die prozentuale Veränderung zwischen Schlusskurs und Eröffnungskurs wird direkt auf dem Chart angezeigt.
Anpassbare Gap-Größe:
Nutzer können über ein einfaches Eingabefeld die minimale Größe der Kurslücke in Prozent festlegen, ab der das Skript die Lücke als relevant markiert.
Visuelle Hervorhebung:
Gap-Ups (positive Lücken) werden in Grün und Gap-Downs (negative Lücken) in Rot hinterlegt, sodass sie leicht identifiziert werden können.
Anwendungsbereich:
Dieses Skript ist ideal für Trader, die Gaps in ihren Analysen nutzen, um potenzielle Marktbewegungen zu identifizieren. Es ermöglicht eine schnelle und visuelle Erkennung von signifikanten Kurslücken direkt auf dem Chart und bietet die Flexibilität, die Definition von "signifikant" an die eigenen Bedürfnisse anzupassen.
Haftungsausschluss:
Dieses Skript dient ausschließlich zu Bildungszwecken. Trading beinhaltet Risiken und ist nicht für jeden Anleger geeignet.
(c) BS IMPACT SCALE GmbH
Скрипт с открытым кодом
В истинном духе TradingView, создатель этого скрипта сделал его открытым исходным кодом, чтобы трейдеры могли проверить и убедиться в его функциональности. Браво автору! Вы можете использовать его бесплатно, но помните, что перепубликация кода подчиняется нашим Правилам поведения.
Отказ от ответственности
Информация и публикации не предназначены для предоставления и не являются финансовыми, инвестиционными, торговыми или другими видами советов или рекомендаций, предоставленных или одобренных TradingView. Подробнее читайте в Условиях использования.