OPEN-SOURCE SCRIPT
382 Detector with Arrows

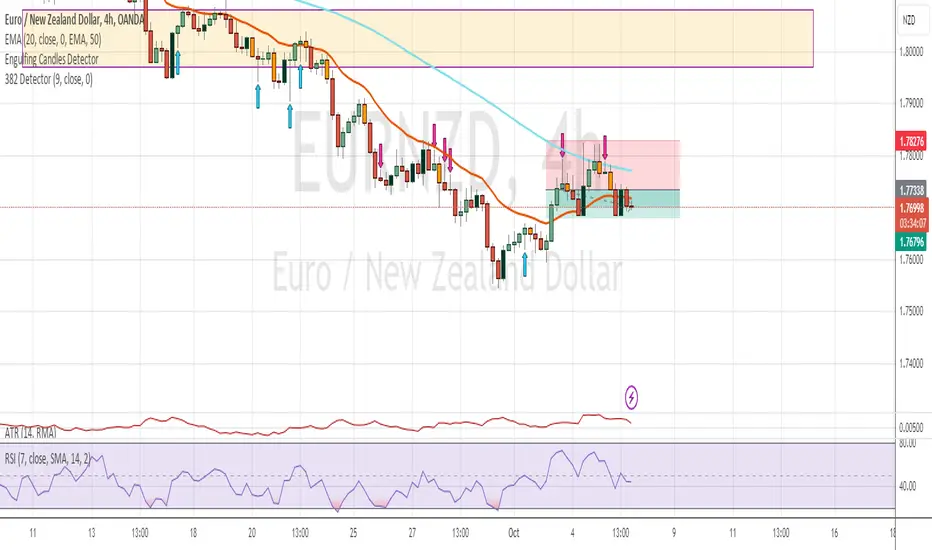
This indicator searches for all 382 candles on the chart.
For a bullish 382 candle, it means that the body of the candle (open to close) are on the top 38.2% of the entire candle (including the wick). Such candlestick pattern displays a bullish pattern because the buyers are in control and pushed for higher prices at the close of the bar.
On the other hand, a bearish 382 candle, the body of the candle (close to open) are on the bottom 38.2% of the entire candle (including the wick). Such candlestick pattern displays a bearish pattern because the sellers are in control and pushed for lower prices at the close of the bar.
If a bullish 382 candle is detected, a light blue arrow will be displayed on the bottom of the candlestick.
If a bearish 382 candle is detected, a pink arrow will be displayed on the top of the candlestick.
Please note that these are only candlestick pattern detectors and are by no means bullish or bearish trade signals. An upward arrow does not represent any long trade opportunity and similarly a downward arrow does not represent any short trade opportunity. These are just visual representation of candlestick patterns. Please trade at your own risk.
Скрипт с открытым кодом
В истинном духе TradingView, создатель этого скрипта сделал его открытым исходным кодом, чтобы трейдеры могли проверить и убедиться в его функциональности. Браво автору! Вы можете использовать его бесплатно, но помните, что перепубликация кода подчиняется нашим Правилам поведения.
Отказ от ответственности
Информация и публикации не предназначены для предоставления и не являются финансовыми, инвестиционными, торговыми или другими видами советов или рекомендаций, предоставленных или одобренных TradingView. Подробнее читайте в Условиях использования.