OPEN-SOURCE SCRIPT
Обновлено [SCL] Bitcoin Hashrate Dips (Miner Capitulation)

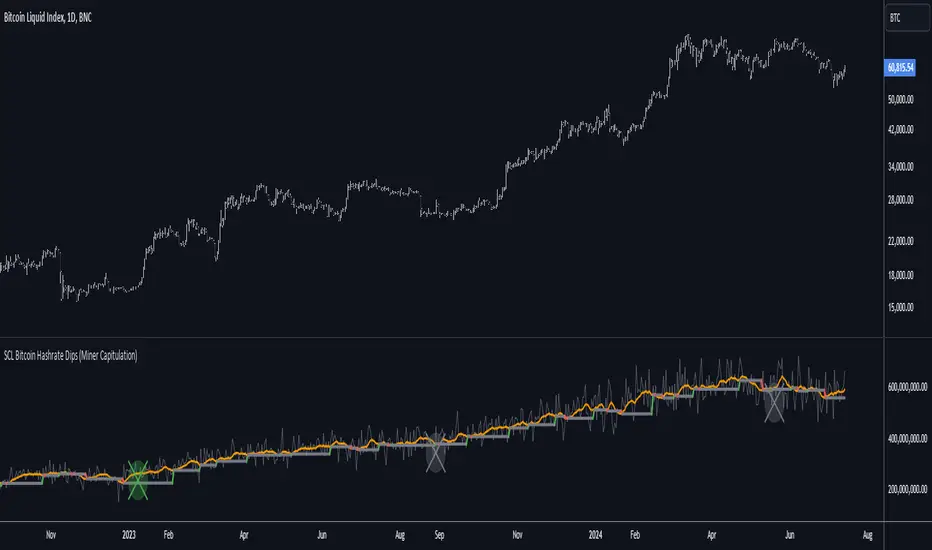
Gives long-term buy signals for Bitcoin from dips and recoveries in the hashrate (the "miner capitulation" theory). It has an overlay and a standalone mode and is fully configurable. It uses Williams Lows and ATR instead of moving averages.
Features that might be interesting for Pinescripters:
+ Automatic (as far as is possible currently) adjustment of plots for overlay and standalone display modes.
+ A neat label function for debugging floats
+ Fully commented
+ The debug that I used to overcome problems in developing it is left in
+ Ideas for how to deal with a wildly oscillating and exponentially increasing data source
You need to run this indicator on the Bitcoin daily chart for it to make any sense. The best is a BTC/USD chart with a long history, such as BNC:BLX.
Информация о релизе
Changed the symbol out for the new one BTC_HASHRATE. Thanks to bkonzman for the tip.Converted to v5.
Скрипт с открытым кодом
В истинном духе TradingView, создатель этого скрипта сделал его открытым исходным кодом, чтобы трейдеры могли проверить и убедиться в его функциональности. Браво автору! Вы можете использовать его бесплатно, но помните, что перепубликация кода подчиняется нашим Правилам поведения.
🆓 All my free scripts: is.gd/simplefree
🔥 Beyond Market Structure Paid Space is now live! is.gd/beyondMS
💰 Trade with me: is.gd/simpletradewithme
🔥 Beyond Market Structure Paid Space is now live! is.gd/beyondMS
💰 Trade with me: is.gd/simpletradewithme
Отказ от ответственности
Информация и публикации не предназначены для предоставления и не являются финансовыми, инвестиционными, торговыми или другими видами советов или рекомендаций, предоставленных или одобренных TradingView. Подробнее читайте в Условиях использования.