Reversal Indicator
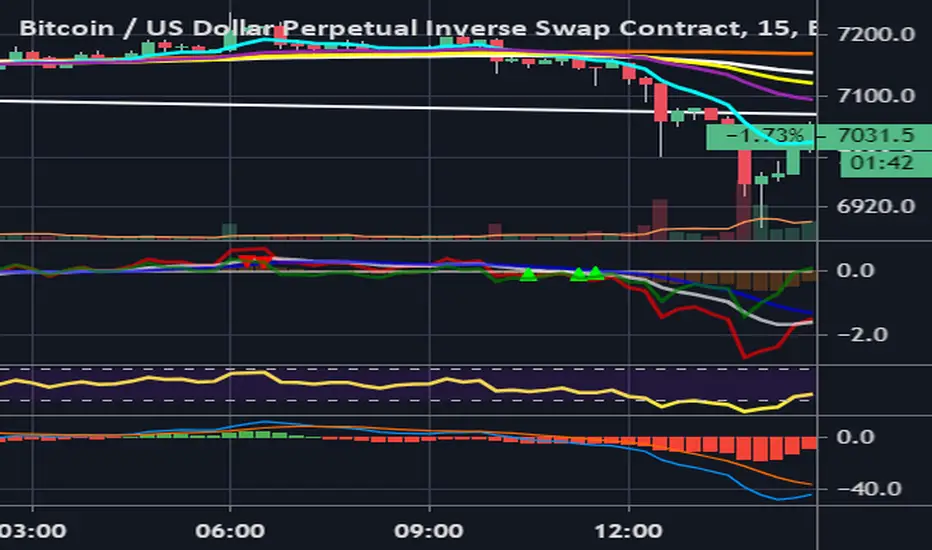
White line is lagging trend line (like MA). When it is above zero axis, it is signaling uptrend and vice versa. The strength of trend is measured by how the red line sustain above the white line and how often the two cross. Indicator can be used on all timeframes, but the higher the timeframe, the stronger the signal with less noise and the greater is the expected move. For example when there is a signal to sell on 1D, 12h and 8h timeframes, it is best to look for good entry signals on 1h, 30m and 15m. On small timeframes (1m - 5m) it works very well during high volatility and high volume periods. During low volume periods there is more noise.
Compared to RSI there are signals formed in times when there is no divergence on RSI.
Скрипт с ограниченным доступом
Доступ к этому скрипту имеют только пользователи, одобренные автором. Вам необходимо запросить и получить разрешение на его использование. Обычно оно предоставляется после оплаты. Для получения подробной информации следуйте инструкциям автора ниже или свяжитесь напрямую с ladaklada.
TradingView НЕ рекомендует оплачивать или использовать скрипт, если вы полностью не доверяете его автору и не понимаете, как он работает. Вы также можете найти бесплатные, открытые альтернативы в наших скриптах сообщества.
Инструкции от автора
Отказ от ответственности
Скрипт с ограниченным доступом
Доступ к этому скрипту имеют только пользователи, одобренные автором. Вам необходимо запросить и получить разрешение на его использование. Обычно оно предоставляется после оплаты. Для получения подробной информации следуйте инструкциям автора ниже или свяжитесь напрямую с ladaklada.
TradingView НЕ рекомендует оплачивать или использовать скрипт, если вы полностью не доверяете его автору и не понимаете, как он работает. Вы также можете найти бесплатные, открытые альтернативы в наших скриптах сообщества.