OPEN-SOURCE SCRIPT
60-Day Cycle Long-Only Indicator
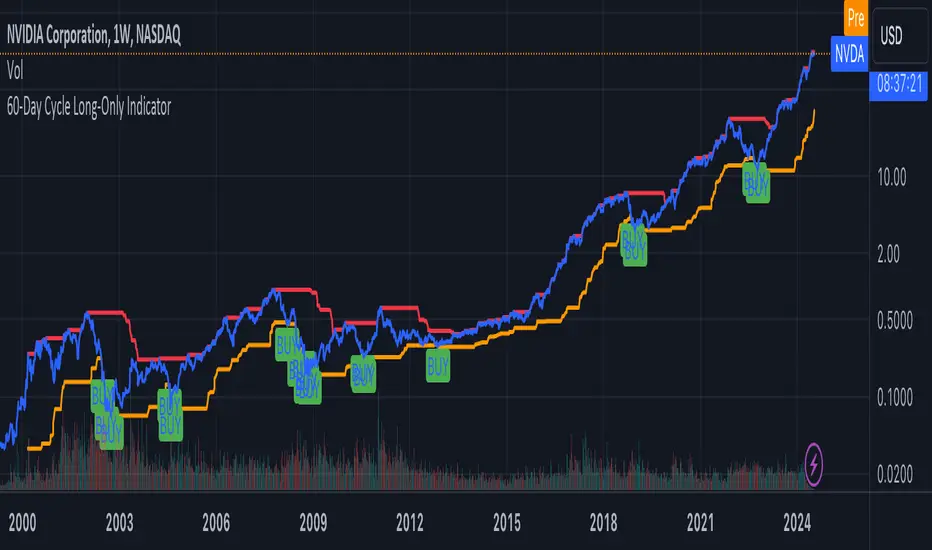
The following indicator generates ‘Buy’ signals based on rotating 60-day cycles. The general theory is that when buying strong, growth-oriented assets, 60-day micro-cycles culminate into larger macro-cycles.
Summary:
Explaining the Upper and Lower Bounds in the 60-Day Cycle Strategy:
1. Cycle High (Upper Bound):
The cycle high is the highest closing price of the asset over the past 60 days. This value acts as the upper boundary of the 60-day cycle, indicating the peak price level during this period. When the current closing price is above this boundary, it suggests a potential distribution phase, where the asset might be overbought, and larger players may be selling off their positions. In the strategy, the cycle high is plotted as a red line on the chart, helping traders visually identify the upper limit of the 60-day trading range.
2. Cycle Low (Lower Bound):
The cycle low is the lowest closing price of the asset over the past 60 days. This value acts as the lower boundary of the 60-day cycle, indicating the trough price level during this period. When the current closing price is below this boundary, it suggests a potential accumulation phase, where the asset might be oversold, and larger players may be accumulating positions at lower prices. In the strategy, the cycle low is plotted as an orange line on the chart, helping traders visually identify the lower limit of the 60-day trading range.
How These Bounds Are Calculated:
• Cycle High: Calculated using the highest closing price over the last 60 trading days. In Pine Script, this is achieved with the function ta.highest(close, cycle_length), where cycle_length is set to 60 days.
• Cycle Low: Calculated using the lowest closing price over the last 60 trading days. In Pine Script, this is achieved with the function ta.lowest(close, cycle_length), where cycle_length is set to 60 days.
Interpretation and Application:
• Buy Signal: A buy signal is generated when the closing price crosses above the cycle low. This indicates a potential end to the bearish phase and the start of a bullish trend.
• Distribution Phase: When the closing price crosses above the cycle high, it suggests the market is in a distribution phase, potentially signaling a bearish trend or a sell-off period.
Example:
On a trading chart, the cycle high and cycle low are plotted as horizontal lines, with their colors distinguishing them (red for cycle high and orange for cycle low). These lines create a visual range within which the asset's price has moved over the last 60 days, helping traders quickly assess whether the current price is near the upper or lower bound.
By identifying and plotting these upper and lower bounds, traders can better understand the current market phase and make more informed trading decisions based on the 60-day cycle strategy. This indicator can be used across various assets.
Скрипт с открытым кодом
В истинном духе TradingView, создатель этого скрипта сделал его открытым исходным кодом, чтобы трейдеры могли проверить и убедиться в его функциональности. Браво автору! Вы можете использовать его бесплатно, но помните, что перепубликация кода подчиняется нашим Правилам поведения.
Отказ от ответственности
Информация и публикации не предназначены для предоставления и не являются финансовыми, инвестиционными, торговыми или другими видами советов или рекомендаций, предоставленных или одобренных TradingView. Подробнее читайте в Условиях использования.