OPEN-SOURCE SCRIPT
Обновлено ATR Percentage

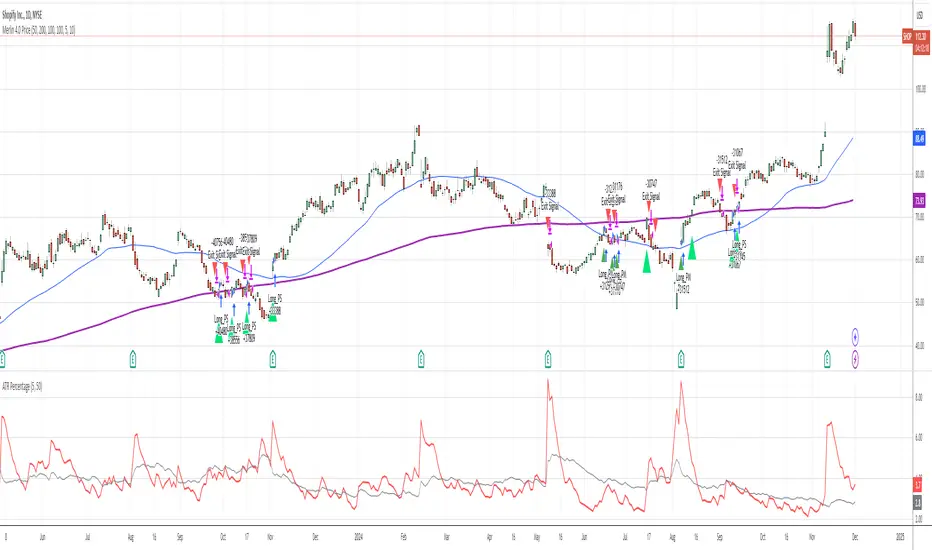
The ATR is a great indicator, but for me, it does not define the volatility of an asset I am looking at well enough. So I've adjusted it to be displayed as the usual ATR and a percentage of the closing prince (which to me tells a better story). I find this useful if I am looking through many assets and have to create a quick picture of volatility.
Indicator Definition: The script starts by defining an indicator named "ATR Percentage" that will be displayed in a separate pane (not overlayed on the price chart).
Input for ATR Period: The user can set the period for calculating the ATR through an input field.
ATR Calculation: The ta.atr function calculates the Average True Range based on the specified period.
ATR Percentage Calculation: The ATR value is converted to a percentage of the current closing price using (atrValue / close) * 100.
Plotting:
The script plots both the ATR value and its percentage on the chart.
A horizontal line at zero is added for reference.
Label Display: An optional label displays the current ATR percentage at every 10th bar to avoid cluttering the chart.
Background Color: A light blue background is added to visually separate the ATR indicator from other indicators.
Информация о релизе
ATR displayed as a percentage.Информация о релизе
ATR Percentage with Baseline is a volatility indicator that expresses the Average True Range (ATR) as a percentage of price, making it easier to compare volatility across different price levels. The indicator features two lines:A short-term ATR percentage (default 5 periods, red line) showing current volatility
A longer-term baseline ATR percentage (default 50 periods, gray line) showing historical or normal volatility levels
This configuration helps traders identify when current volatility is deviating from typical levels. Optional features include displaying the raw ATR value, zero line, and background coloring. All components can be toggled on/off through the indicator settings.
Primarily useful for:
Comparing volatility across different price levels
Identifying periods of abnormal volatility
Adjusting position sizes based on current market conditions
Setting dynamic stop levels
Скрипт с открытым кодом
В истинном духе TradingView, создатель этого скрипта сделал его открытым исходным кодом, чтобы трейдеры могли проверить и убедиться в его функциональности. Браво автору! Вы можете использовать его бесплатно, но помните, что перепубликация кода подчиняется нашим Правилам поведения.
Отказ от ответственности
Информация и публикации не предназначены для предоставления и не являются финансовыми, инвестиционными, торговыми или другими видами советов или рекомендаций, предоставленных или одобренных TradingView. Подробнее читайте в Условиях использования.