PROTECTED SOURCE SCRIPT
Обновлено Six Sigma Enhanced
This script is a study of the Two Six Sigma patterns explored in the December 2018 issue of Technical Analysis of Stocks & Commodities (Stocks & Commodities V. 36:12 (8–12): Identifying High-Probability Buy Signals by François Picard, MS , & Edmond Miresco, PhD )
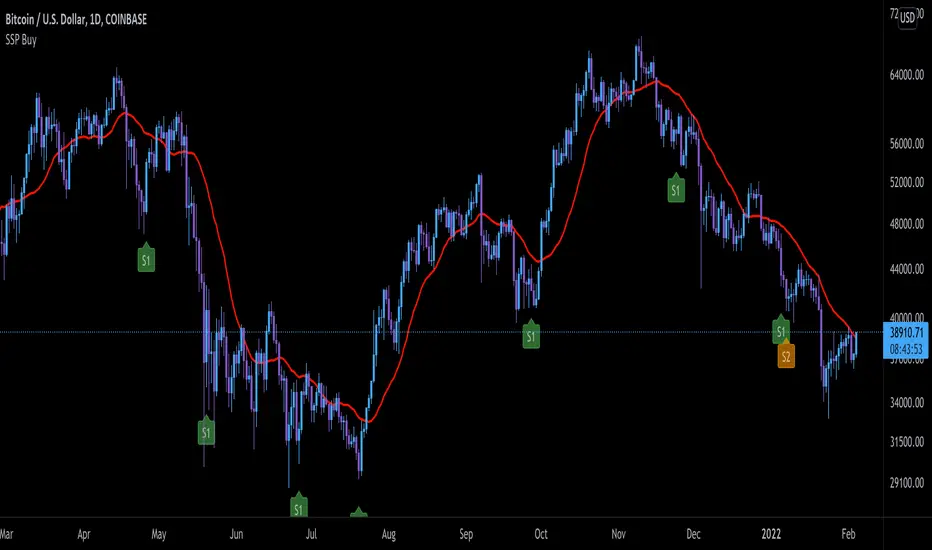
Signal 1 - 9 Closes Under MA
The first (Signal #1 or S1 on the chart) indicates 9 consecutive closes below the 20-period moving average. In the study, the authors used a simple moving average however I have modified it to use a MA to account for price distribution
Signal 2 - 6 Lower Closes and 9 Closes Under MA
The second signal (Signal #2 or S2 on the chart) indicates six consecutive periods where the close value is lower than the previous close and Signal 1.
Filter Signal Code provided by tradingview.com/u/AllTradeSignals/
Информация о релизе
SMA is used to calculate plot lineИнформация о релизе
migrated to v5Скрипт с защищённым кодом
Этот скрипт опубликован с закрытым исходным кодом. Однако вы можете использовать его свободно и без каких-либо ограничений — читайте подробнее здесь.
Отказ от ответственности
Информация и публикации не предназначены для предоставления и не являются финансовыми, инвестиционными, торговыми или другими видами советов или рекомендаций, предоставленных или одобренных TradingView. Подробнее читайте в Условиях использования.
Скрипт с защищённым кодом
Этот скрипт опубликован с закрытым исходным кодом. Однако вы можете использовать его свободно и без каких-либо ограничений — читайте подробнее здесь.
Отказ от ответственности
Информация и публикации не предназначены для предоставления и не являются финансовыми, инвестиционными, торговыми или другими видами советов или рекомендаций, предоставленных или одобренных TradingView. Подробнее читайте в Условиях использования.