OPEN-SOURCE SCRIPT
Volume vs Price Impact Z-Score
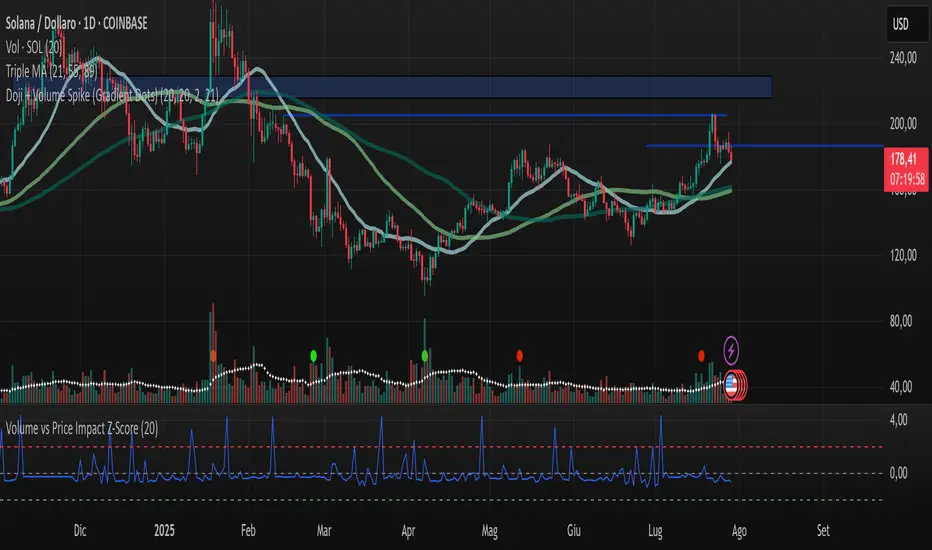
Volume vs Price Impact Z‑Score
This indicator measures how disproportionate the traded volume is relative to the price movement of a candle.
Step 1: Volume-to-Price Impact (VPI)
VPI = Volume / (abs(Close - Open) + ε)
(or optionally using High - Low as the price range)
Step 2: Z‑Score Standardization
Z = (VPI - SMA(VPI, length)) / STDEV(VPI, length)
Interpretation:
Z > 2 → High volume with little price movement → possible absorption (accumulation/distribution).
Z < -2 → Large price move with low volume → weak or illiquid move (potential false breakout).
Use cases:
Detecting accumulation/distribution phases.
Highlighting false breakouts or weak price moves.
Supporting entry/exit decisions based on market efficiency (volume vs. price impact).
Скрипт с открытым кодом
В истинном духе TradingView, создатель этого скрипта сделал его открытым исходным кодом, чтобы трейдеры могли проверить и убедиться в его функциональности. Браво автору! Вы можете использовать его бесплатно, но помните, что перепубликация кода подчиняется нашим Правилам поведения.
Отказ от ответственности
Информация и публикации не предназначены для предоставления и не являются финансовыми, инвестиционными, торговыми или другими видами советов или рекомендаций, предоставленных или одобренных TradingView. Подробнее читайте в Условиях использования.