OPEN-SOURCE SCRIPT
MA-SAR-BB-SR - BisayaTC
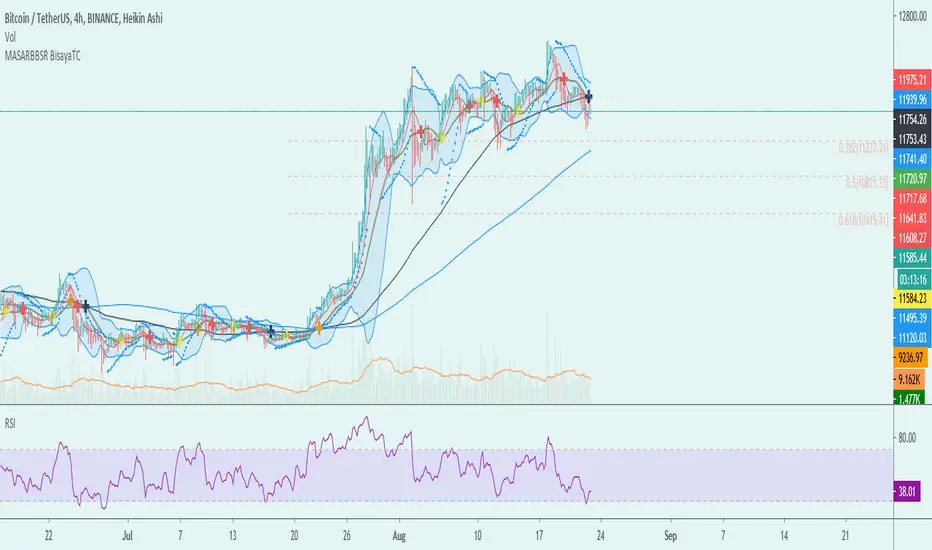
The script allows you to use multiple indicators such as Moving Averages, Parabolic SAR, Bollinger Bands, Support and Resistance and it includes alerts for each indicator.
MA - The moving average (MA) is a simple technical analysis tool that smooths out price data by creating a constantly updated average price. The average is taken over a specific period of time, like 10 days, 20 minutes, 30 weeks or any time period the trader chooses.
SAR - The Parabolic SAR is a technical indicator developed by J. Welles Wilder to determine the direction that an asset is moving. The indicator is also referred to as a stop and reverse system, which is abbreviated as SAR. It aims to identify potential reversals in the price movement of traded assets.
BB- Bollinger Bands are envelopes plotted at a standard deviation level above and below a simple moving average of the price. Because the distance of the bands is based on standard deviation, they adjust to volatility swings in the underlying price.
SR - Support and Resistance are certain predetermined levels of the price of a security at which it is thought that the price will tend to stop and reverse. These levels are denoted by multiple touches of price without a breakthrough of the level.
DISCLAIMER: For educational purposes only. Nothing in this content should be interpreted as financial advice or a recommendation to buy or sell any sort of security or investment including all types of crypto. DYOR
Скрипт с открытым кодом
В истинном духе TradingView, создатель этого скрипта сделал его открытым исходным кодом, чтобы трейдеры могли проверить и убедиться в его функциональности. Браво автору! Вы можете использовать его бесплатно, но помните, что перепубликация кода подчиняется нашим Правилам поведения.
Отказ от ответственности
Информация и публикации не предназначены для предоставления и не являются финансовыми, инвестиционными, торговыми или другими видами советов или рекомендаций, предоставленных или одобренных TradingView. Подробнее читайте в Условиях использования.