PROTECTED SOURCE SCRIPT
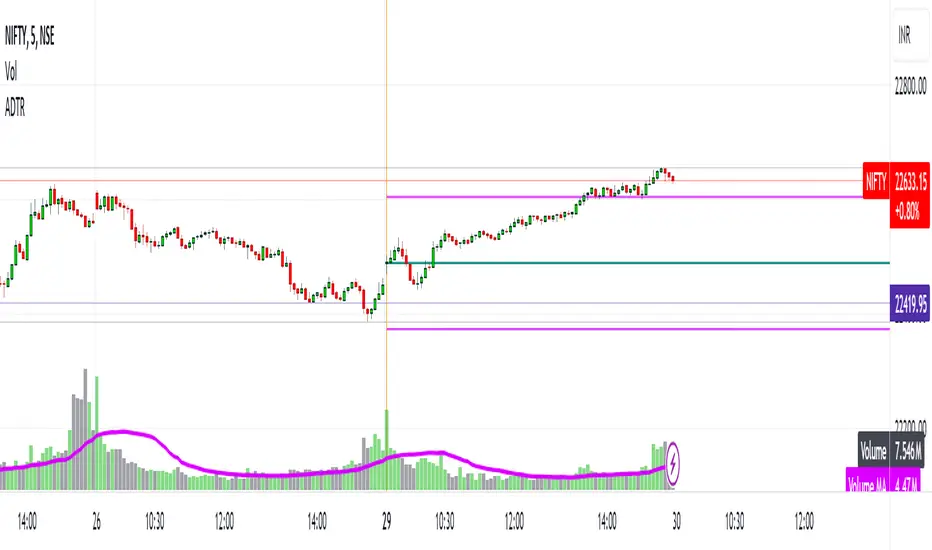
Artharjan Day Trading Range

Hi,
I have created Artharjan Day Trading Range indicator that plots the Intraday Trading Range for the day based on past 5 Days ATR value and takes 50% of that value and plots it above and below the current day's opening price. If current day close crosses above the Upper Level then we may see a Bullish trend otherwise Bearish trend can be seen. If the price trades between these two levels then options writers can write the Call options above Upper Level and Put options below Lower Levels.
I hope traders would love to use this script for trading Options.
Regards
Rrahul Desai
Artharjan
Скрипт с защищённым кодом
Этот скрипт опубликован с закрытым исходным кодом. Однако вы можете использовать его свободно и без каких-либо ограничений — читайте подробнее здесь.
I am a professional trader and have passion for teaching and programming. In case anyone is interested to know more then feel to drop me a line at rahul30m@gmail.com / +91-9136096161
Отказ от ответственности
Информация и публикации не предназначены для предоставления и не являются финансовыми, инвестиционными, торговыми или другими видами советов или рекомендаций, предоставленных или одобренных TradingView. Подробнее читайте в Условиях использования.