OPEN-SOURCE SCRIPT
Обновлено Tandem EMA Trends
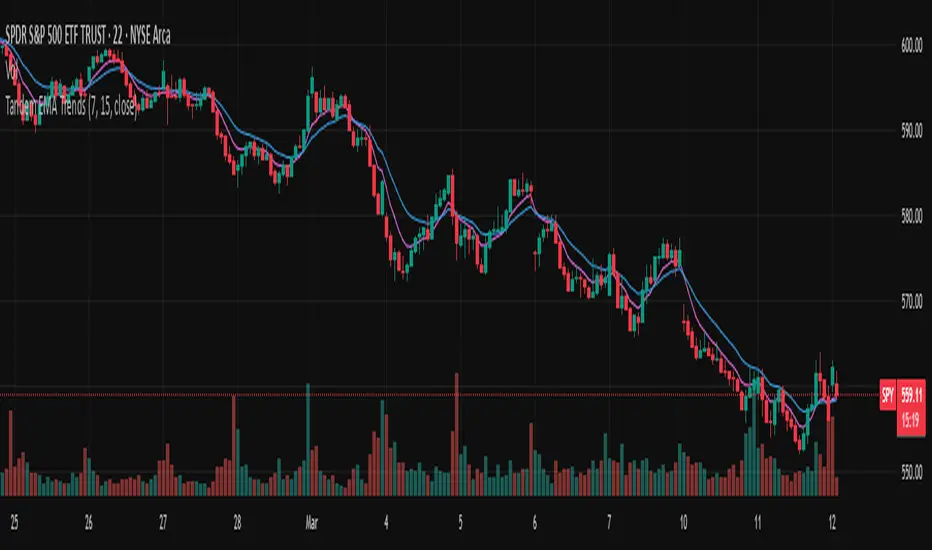
This indicator helps to identify trends using 2 (tandem) EMAs: a fast EMA and a slow EMA. Set the lengths of the EMAs in the inputs (fast EMA should be a smaller number than the slow EMA).
The trend is bullish if the current value of the fast EMA > current value of the slow EMA AND the current value of the fast EMA > the prior bar's value of the fast EMA.
The trend is bearish if the current value of the fast EMA < current value of the slow EMA AND the current value of the fast EMA < the prior bar's value of the fast EMA.
The fast EMA is countertrend to the slow EMA if either of the following 2 conditions exist:
The current value of the fast EMA > current value of the slow EMA AND the current value of the fast EMA < the prior bar's value of the fast EMA (bullish countertrend).
-OR-
The current value of the fast EMA < current value of the slow EMA AND the current value of the fast EMA > the prior bar's value of the fast EMA (bearish countertrend).
Use this script to set custom alerts based off of the current trend like sending webhooks when specific conditions exist.
Customize the colors of the plots.
Информация о релизе
Added a checkbox for "Market hours only"Скрипт с открытым кодом
В истинном духе TradingView, создатель этого скрипта сделал его открытым исходным кодом, чтобы трейдеры могли проверить и убедиться в его функциональности. Браво автору! Вы можете использовать его бесплатно, но помните, что перепубликация кода подчиняется нашим Правилам поведения.
Отказ от ответственности
Информация и публикации не предназначены для предоставления и не являются финансовыми, инвестиционными, торговыми или другими видами советов или рекомендаций, предоставленных или одобренных TradingView. Подробнее читайте в Условиях использования.
Скрипт с открытым кодом
В истинном духе TradingView, создатель этого скрипта сделал его открытым исходным кодом, чтобы трейдеры могли проверить и убедиться в его функциональности. Браво автору! Вы можете использовать его бесплатно, но помните, что перепубликация кода подчиняется нашим Правилам поведения.
Отказ от ответственности
Информация и публикации не предназначены для предоставления и не являются финансовыми, инвестиционными, торговыми или другими видами советов или рекомендаций, предоставленных или одобренных TradingView. Подробнее читайте в Условиях использования.