OPEN-SOURCE SCRIPT
Обновлено Historical Volatility Bands [Loxx]
Historical Volatility Bands are constructed using:
What is Historical Volatility?
Historical Volatility (HV) is a statistical measure of the dispersion of returns for a given security or market index over a given period of time. Generally, this measure is calculated by determining the average deviation from the average price of a financial instrument in the given time period. Using standard deviation is the most common, but not the only, way to calculate Historical Volatility.
The higher the Historical Volatility value, the riskier the security. However, that is not necessarily a bad result as risk works both ways - bullish and bearish, i.e: Historical Volatility is not a directional indicator and should not be used as other directional indicators are used. Use to to determine the rising and falling price change volatility.
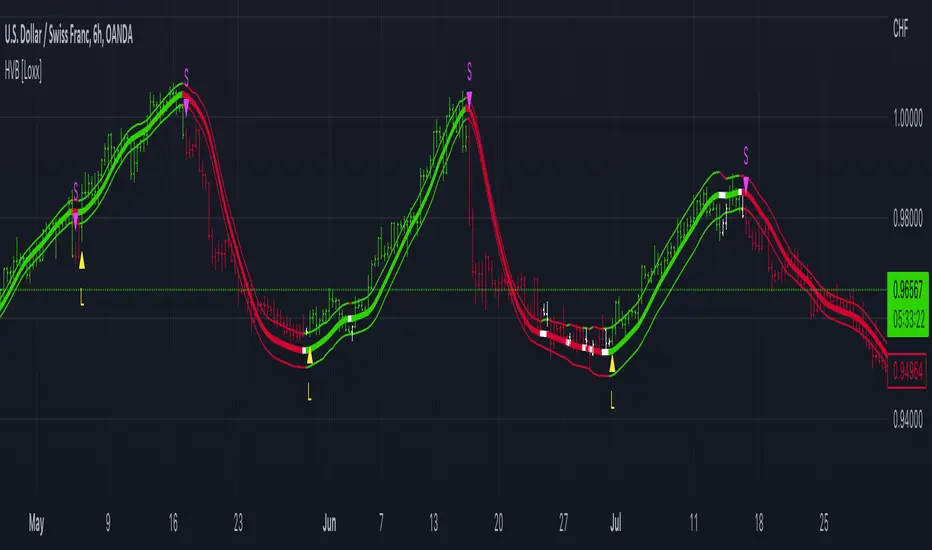
The color of the middle line, unlike the bands colors, has 3 colors. When colors of the bands are the same, then the middle line has the same color, otherwise it's white.
Included
- Average as the middle line.
- Upper and lower bands using the Historical Volatility for bands calculation.
What is Historical Volatility?
Historical Volatility (HV) is a statistical measure of the dispersion of returns for a given security or market index over a given period of time. Generally, this measure is calculated by determining the average deviation from the average price of a financial instrument in the given time period. Using standard deviation is the most common, but not the only, way to calculate Historical Volatility.
The higher the Historical Volatility value, the riskier the security. However, that is not necessarily a bad result as risk works both ways - bullish and bearish, i.e: Historical Volatility is not a directional indicator and should not be used as other directional indicators are used. Use to to determine the rising and falling price change volatility.
The color of the middle line, unlike the bands colors, has 3 colors. When colors of the bands are the same, then the middle line has the same color, otherwise it's white.
Included
- Alerts
- Signals
- Loxx's Expanded Source Types
- Bar coloring
Информация о релизе
Updated to handle all timeframes and all tickers. Скрипт с открытым кодом
В истинном духе TradingView, создатель этого скрипта сделал его открытым исходным кодом, чтобы трейдеры могли проверить и убедиться в его функциональности. Браво автору! Вы можете использовать его бесплатно, но помните, что перепубликация кода подчиняется нашим Правилам поведения.
Public Telegram Group, t.me/algxtrading_public
VIP Membership Info: patreon.com/algxtrading/membership
VIP Membership Info: patreon.com/algxtrading/membership
Отказ от ответственности
Информация и публикации не предназначены для предоставления и не являются финансовыми, инвестиционными, торговыми или другими видами советов или рекомендаций, предоставленных или одобренных TradingView. Подробнее читайте в Условиях использования.
Скрипт с открытым кодом
В истинном духе TradingView, создатель этого скрипта сделал его открытым исходным кодом, чтобы трейдеры могли проверить и убедиться в его функциональности. Браво автору! Вы можете использовать его бесплатно, но помните, что перепубликация кода подчиняется нашим Правилам поведения.
Public Telegram Group, t.me/algxtrading_public
VIP Membership Info: patreon.com/algxtrading/membership
VIP Membership Info: patreon.com/algxtrading/membership
Отказ от ответственности
Информация и публикации не предназначены для предоставления и не являются финансовыми, инвестиционными, торговыми или другими видами советов или рекомендаций, предоставленных или одобренных TradingView. Подробнее читайте в Условиях использования.