OPEN-SOURCE SCRIPT
Обновлено Relative Strength NSE:Nifty for TF Community
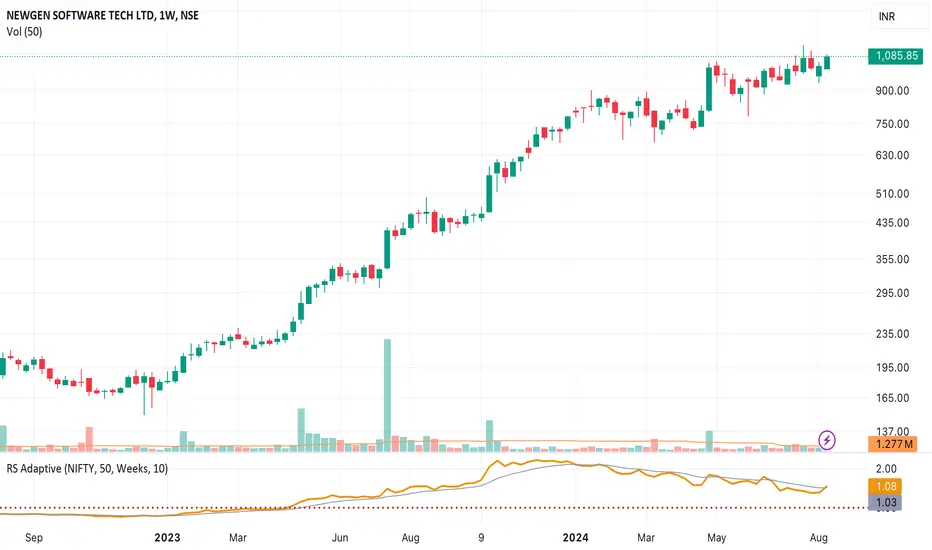
This is a modified version of the Relative Strength Indicator (No confusion with RSI) originally by in.tradingview.com/u/modhelius/ based on in.tradingview.com/script/A4WyMCKM-Relative-Strength/. The indicator calculates the relative strength between a selected stock and a comparative symbol (typically a market index like NSE:NIFTY).
Relative strength (RS) compares the performance of two assets, typically a stock and a market index, by dividing their percentage changes over a specific period. This indicator oscillates around zero:
- Greater than 0: Indicates the stock has outperformed the comparative symbol.
- Less than 0: Indicates the stock has underperformed the comparative symbol.
Key Enhancements:
This Relative Strength Indicator offers practical features to automatically adjusts the comparison period based on the chart’s timeframe, whether daily, weekly, or monthly, so you don’t have to make manual changes.
Secondly, if the selected stock has fewer bars than the comparison period, the indicator uses the shorter period to ensure accurate results. The default colors are hardcoded so they look fine for both dark and white themes, but of course can be changed.
You can customise the settings to fit your needs. The default period is set to 50/52, and the comparative symbol is NSE:NIFTY, but both can be changed. There’s also an option to toggle a moving average on or off, providing a smoother visual representation.
Информация о релизе
Change the SMA to EMA as per TF Community recommendation - Exponential MA is better than Simple MA. Информация о релизе
Chart changed to simple one. Скрипт с открытым кодом
В истинном духе TradingView, создатель этого скрипта сделал его открытым исходным кодом, чтобы трейдеры могли проверить и убедиться в его функциональности. Браво автору! Вы можете использовать его бесплатно, но помните, что перепубликация кода подчиняется нашим Правилам поведения.
Отказ от ответственности
Информация и публикации не предназначены для предоставления и не являются финансовыми, инвестиционными, торговыми или другими видами советов или рекомендаций, предоставленных или одобренных TradingView. Подробнее читайте в Условиях использования.
Скрипт с открытым кодом
В истинном духе TradingView, создатель этого скрипта сделал его открытым исходным кодом, чтобы трейдеры могли проверить и убедиться в его функциональности. Браво автору! Вы можете использовать его бесплатно, но помните, что перепубликация кода подчиняется нашим Правилам поведения.
Отказ от ответственности
Информация и публикации не предназначены для предоставления и не являются финансовыми, инвестиционными, торговыми или другими видами советов или рекомендаций, предоставленных или одобренных TradingView. Подробнее читайте в Условиях использования.