PROTECTED SOURCE SCRIPT
ELVTDFinance COT

ELVTDFinance COT Indicator:
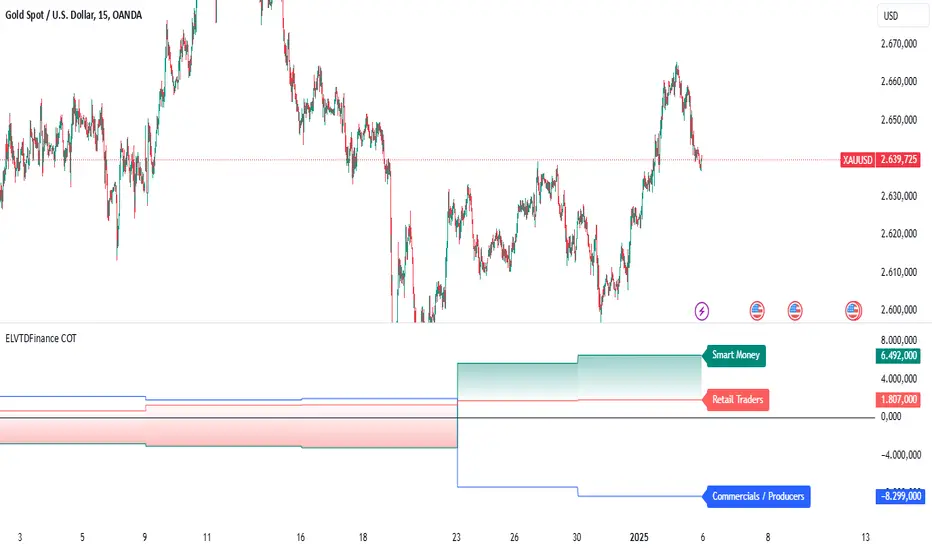
The ELVTDFinance COT Indicator is a sophisticated tool designed for traders seeking to gain deeper insights into market dynamics through Commitment of Traders (COT) data. This indicator visually represents the net positions of three distinct market participant groups: Commercials, Non-Commercials (Smart Money), and Retail Traders, enabling traders to interpret sentiment and potential market direction.
Key Features:
COT Data Integration:
Pulls weekly COT data from TradingView's LibraryCOT.
Distinguishes between long and short positions for each participant type:
Commercials: Producers or hedgers with vested interest in stabilizing market conditions.
Non-Commercials (Smart Money): Speculative traders often driving trends.
Retail Traders: Non-reportable positions, typically indicative of retail sentiment.
Net Position Calculations:
The indicator calculates and plots the net position (long - short) for each group.
Provides a clear visual distinction of market positioning trends over time.
Dynamic Plot Styles:
Adapts to the timeframe:
Weekly/Monthly: Line plots for a smoother view of trends.
Other Timeframes: Step-line plots for precise position changes.
Color Coding:
Blue: Commercials (Producers/Hedgers).
Teal: Non-Commercials (Smart Money).
Red: Retail Traders.
Highlights Market Sentiment:
Uses a color-shift mechanism based on the relative strength of Smart Money vs. Retail Traders.
Turns green when Smart Money positions dominate retail sentiment, signaling potential trend reversals or continuations.
Labels and Visual Aids:
Displays labels with net positions for each participant group on the chart.
Ensures clarity in understanding which group is leading the market at any point in time.
Advanced Visual Fill:
Shaded regions between Smart Money and Retail Traders provide an intuitive visual cue for sentiment alignment or divergence.
Support for Scalping and Swing Trading:
Offers utility for both short-term scalping strategies and longer-term swing trades by identifying the actions of dominant market forces.
How It Works:
The indicator retrieves and processes COT data weekly.
Net positions are calculated and compared across participant groups.
Plots are dynamically updated to reflect market sentiment.
A zero-line acts as a reference to gauge whether the group is net long or net short.
Use Case Examples:
Trend Reversal Signals:
If Smart Money positions increase while Retail Traders are heavily short, it may signal a potential bullish reversal.
Trend Confirmation:
Alignments between Smart Money and Retail Trader trends can confirm a strong directional move.
Hedging Insights:
Commercials often hedge against price movements. Their actions can hint at supply-side expectations.
By leveraging the ELVTDFinance COT Indicator, traders can better understand the driving forces behind market moves and incorporate this into their decision-making processes. This tool is particularly valuable for analyzing sentiment shifts and gauging market momentum.
Скрипт с защищённым кодом
Этот скрипт опубликован с закрытым исходным кодом. Однако вы можете использовать его свободно и без каких-либо ограничений — читайте подробнее здесь.
Отказ от ответственности
Информация и публикации не предназначены для предоставления и не являются финансовыми, инвестиционными, торговыми или другими видами советов или рекомендаций, предоставленных или одобренных TradingView. Подробнее читайте в Условиях использования.