OPEN-SOURCE SCRIPT
Vertical and Horizontal Lines on given Dates

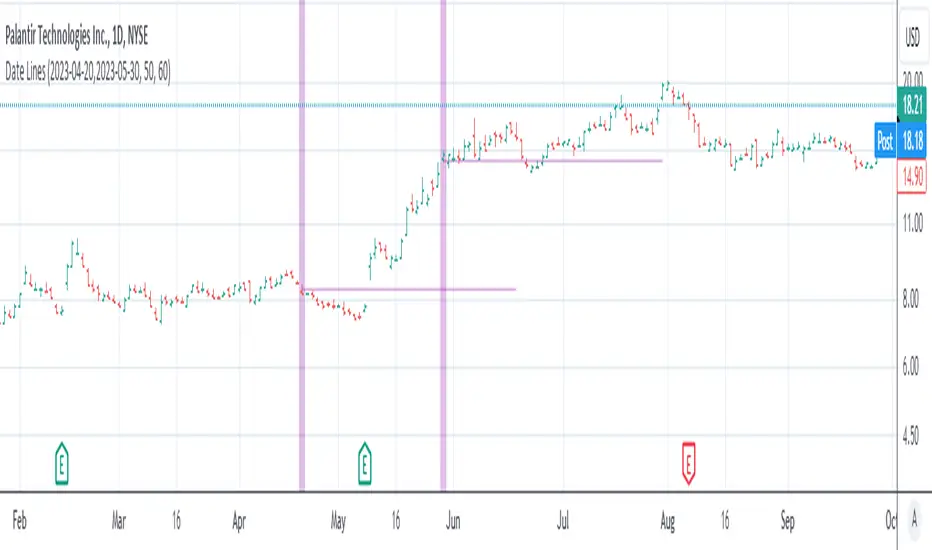
This simple indicator is to show the impact of given dates on the chart:
The dates need to be entered in a yyyy-MM-dd format, separated by comma (,) or space+comma ( ,).
The event can be shown on the chart with a vertical highlighting.
The midpoint of the price action that day can be shown as a vertical line.
Hint: If you load a lot of dates into it, best disable the "Indicator Arguments" in "Chart Settings" -> "Status line" to not have the chart littered with these date arguments.
Скрипт с открытым кодом
В истинном духе TradingView, создатель этого скрипта сделал его открытым исходным кодом, чтобы трейдеры могли проверить и убедиться в его функциональности. Браво автору! Вы можете использовать его бесплатно, но помните, что перепубликация кода подчиняется нашим Правилам поведения.
Отказ от ответственности
Информация и публикации не предназначены для предоставления и не являются финансовыми, инвестиционными, торговыми или другими видами советов или рекомендаций, предоставленных или одобренных TradingView. Подробнее читайте в Условиях использования.