OPEN-SOURCE SCRIPT
Обновлено Bitcoin Risk Metric II
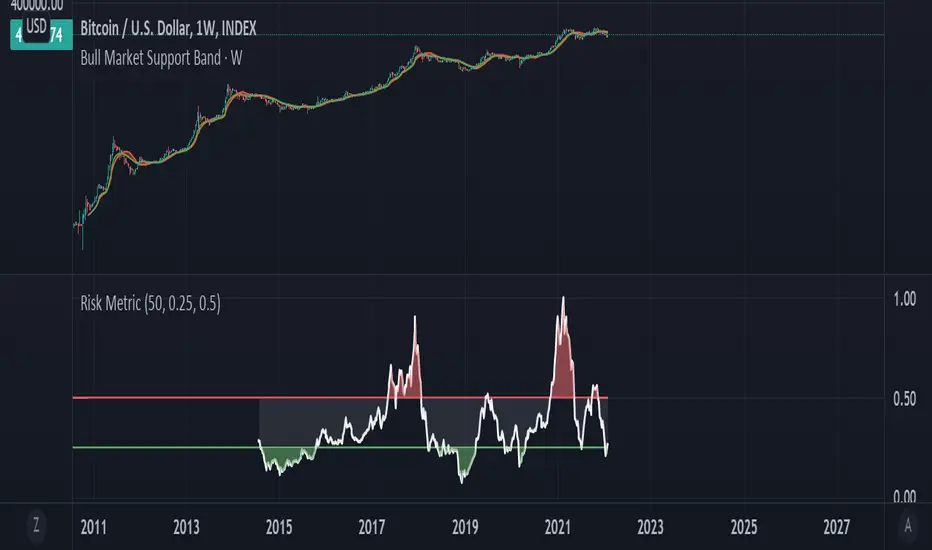
Thesis: Bitcoin's price movements can be (dubiously) characterized by functional relationships between moving averages and standard deviations. These movements can be normalized into a risk metric through normalization functions of time. This risk metric may be able to quantify a long term "buy low, sell high" strategy.
This risk metric is the average of three normalized metrics:
1. (btc - 4 yma)/ (std dev)
2. ln(btc / 20 wma)
3. (50 dma)/(50 wma)
* btc = btc price
* yma = yearly moving average of btc, wma = weekly moving average of btc, dma = daily moving average of btc
* std dev = std dev of btc
Important note:
Historical data for this metric is only shown back until 2014, because of the nature of the 1st mentioned metric. The other two metrics produce a value back until 2011. A previous, less robust, version of metric 2 is posted on my TradingView as well.
Информация о релизе
Tidied up code. Скрипт с открытым кодом
В истинном духе TradingView, создатель этого скрипта сделал его открытым исходным кодом, чтобы трейдеры могли проверить и убедиться в его функциональности. Браво автору! Вы можете использовать его бесплатно, но помните, что перепубликация кода подчиняется нашим Правилам поведения.
Отказ от ответственности
Информация и публикации не предназначены для предоставления и не являются финансовыми, инвестиционными, торговыми или другими видами советов или рекомендаций, предоставленных или одобренных TradingView. Подробнее читайте в Условиях использования.
Скрипт с открытым кодом
В истинном духе TradingView, создатель этого скрипта сделал его открытым исходным кодом, чтобы трейдеры могли проверить и убедиться в его функциональности. Браво автору! Вы можете использовать его бесплатно, но помните, что перепубликация кода подчиняется нашим Правилам поведения.
Отказ от ответственности
Информация и публикации не предназначены для предоставления и не являются финансовыми, инвестиционными, торговыми или другими видами советов или рекомендаций, предоставленных или одобренных TradingView. Подробнее читайте в Условиях использования.