OPEN-SOURCE SCRIPT
Monthly Seasonality Trend [DunesIsland]
The Monthly Seasonality Trend [DunesIsland] is a indicator designed to analyze and visualize historical monthly seasonality patterns in financial markets. By calculating the average monthly return over a user-configurable lookback period (1 to 10 years), this indicator provides traders and investors with a clear projection of potential price movements for the current month, enabling data-driven decision-making.
How It Works
The indicator operates by retrieving monthly open and close prices for the specified lookback period (up to 10 years) and computing the average percentage return for the current month based on historical data. Key functionalities include:
How to Interpret
How It Works
The indicator operates by retrieving monthly open and close prices for the specified lookback period (up to 10 years) and computing the average percentage return for the current month based on historical data. Key functionalities include:
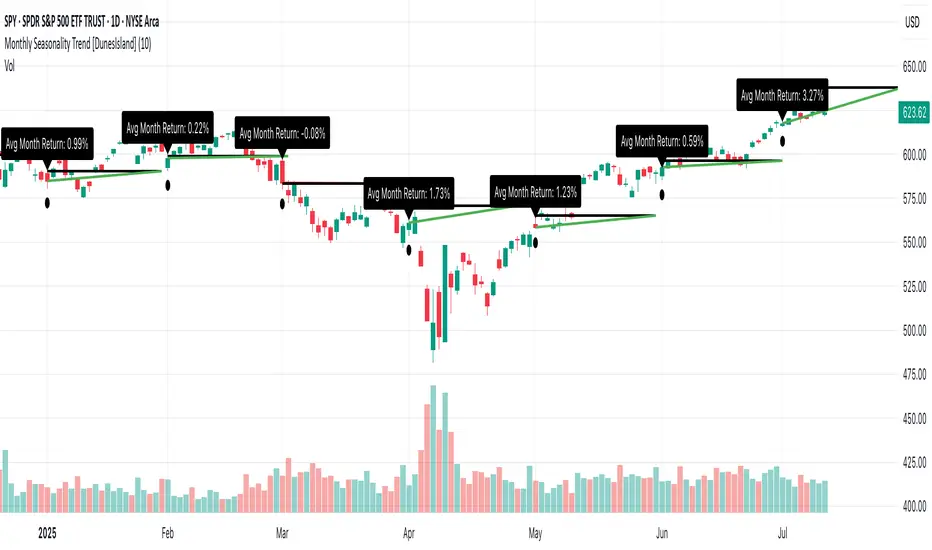
- Dynamic Trend Line: On the first trading day of each month, the indicator plots a line projecting the expected price trajectory, starting from the current close price and extending to the estimated end-of-month price based on the average historical return. The line is colored green for anticipated price increases or red for expected declines, offering an intuitive visual cue.
- Average Return Label: A label is displayed at the start of each month, detailing the calculated average historical return for that month, expressed as a percentage, to provide context for the projected trend.
- First Trading Day Marker: A small circle is plotted below the bar on the first trading day of each month, clearly marking the start of the projection period.
- Adaptive Bar Counting: The indicator dynamically adjusts the length of the trend line based on the actual number of trading days in the previous month, ensuring accurate projections.
How to Interpret
- Bullish Projection (Green Line): Indicates that historical data suggests an average price increase for the current month, potentially signaling buying opportunities.
- Bearish Projection (Red Line): Suggests an average price decline based on historical trends, which may prompt caution or short-selling strategies.
- Historical Context: The average return label provides a quantitative measure of past performance, helping traders assess the reliability of the projected trend.
Скрипт с открытым кодом
В истинном духе TradingView, создатель этого скрипта сделал его открытым исходным кодом, чтобы трейдеры могли проверить и убедиться в его функциональности. Браво автору! Вы можете использовать его бесплатно, но помните, что перепубликация кода подчиняется нашим Правилам поведения.
Отказ от ответственности
Информация и публикации не предназначены для предоставления и не являются финансовыми, инвестиционными, торговыми или другими видами советов или рекомендаций, предоставленных или одобренных TradingView. Подробнее читайте в Условиях использования.