PROTECTED SOURCE SCRIPT
Обновлено Open to High/Low % Movement

to track the movement of open to low and open to high in % terms, please create a trading view pine script which can plot this movement in a separate chart
Информация о релизе
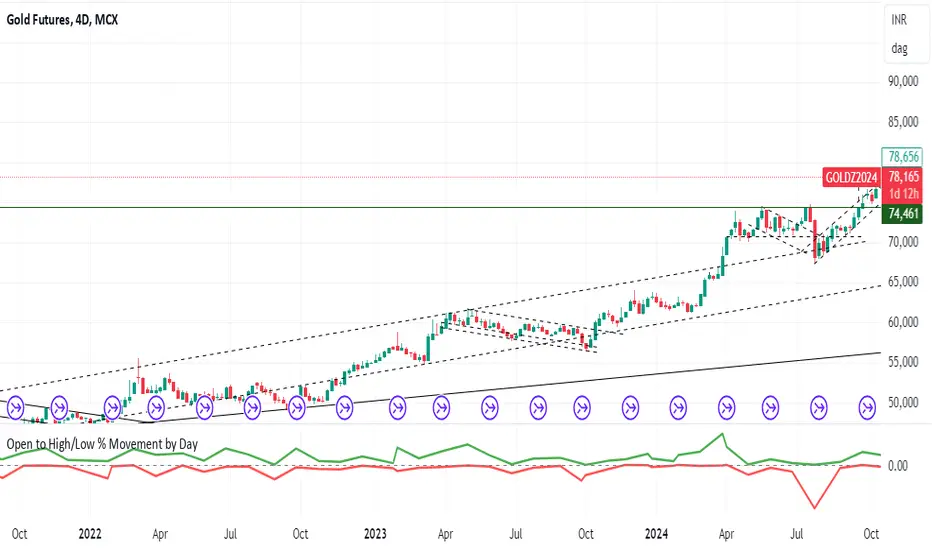
### Description of the "Open to High/Low % Movement by Day" IndicatorThis custom TradingView indicator displays the percentage movement from the open price to the high price (Open-to-High) and from the open price to the low price (Open-to-Low) for each trading day. The purpose of this indicator is to help traders analyze the intraday price volatility relative to the open price on a given day.
#### Key Features:
1. **Open-to-High and Open-to-Low Movement**:
- The indicator calculates the percentage change from the open price to both the highest and lowest points of each trading session.
- Positive values (green line) represent the percentage increase from the open to the high, while negative values (red line) represent the decrease from the open to the low.
2. **Day Filter**:
- A unique feature of this indicator is the ability to filter the data by a specific day of the week (from Monday to Friday).
- By selecting a specific day in the settings, users can isolate and view data only for that day (e.g., Mondays) to analyze weekday-specific trends.
- Setting the day filter to "All Days" will display data for every trading day.
3. **Separate Chart Pane**:
- The indicator is displayed in a separate pane below the main price chart, helping to keep the main chart uncluttered while providing a clear view of percentage movements.
4. **Reference Zero Line**:
- A horizontal zero line is included to help differentiate positive and negative movements relative to the open price.
#### How to Use:
- **Identify Trends for Specific Days**: By selecting a specific day, traders can analyze if a particular weekday consistently exhibits certain patterns, such as larger-than-average movements.
- **Measure Intraday Volatility**: This indicator can help traders quickly see how volatile a particular day is compared to others, as it shows both upward and downward movement percentages.
- **Assess Market Sentiment**: Large positive or negative movements relative to the open may indicate strong buying or selling pressure, providing potential insight into market sentiment on a given day.
This tool can be valuable for day traders and swing traders looking to identify patterns based on intraday volatility across different days of the week.
Скрипт с защищённым кодом
Этот скрипт опубликован с закрытым исходным кодом. Однако вы можете использовать его свободно и без каких-либо ограничений — читайте подробнее здесь.
Отказ от ответственности
Информация и публикации не предназначены для предоставления и не являются финансовыми, инвестиционными, торговыми или другими видами советов или рекомендаций, предоставленных или одобренных TradingView. Подробнее читайте в Условиях использования.