PROTECTED SOURCE SCRIPT
Обновлено BiasByCryptx
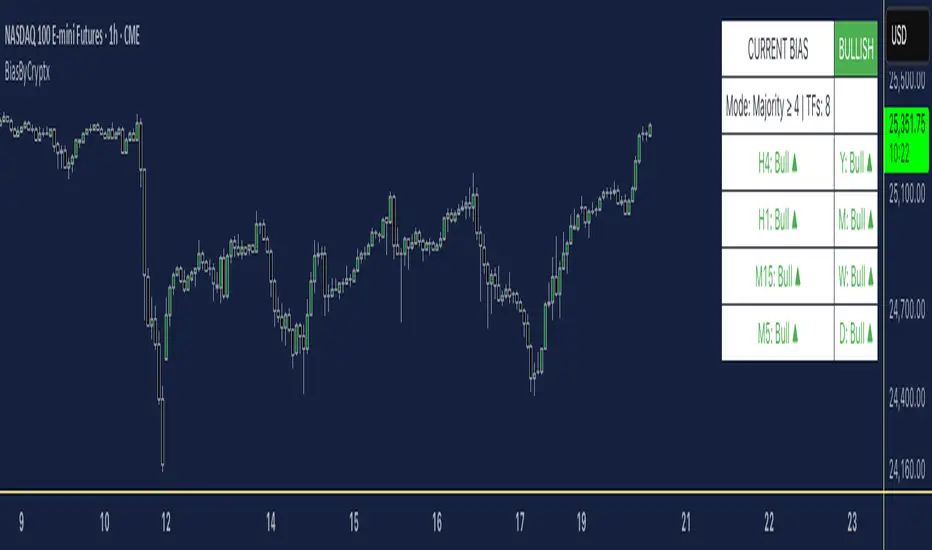
This is a lightweight market-bias dashboard. For each selected timeframe, Prior Year, Month, Week, Day, H4, H1. It uses the previous completed period’s high and low to compute the 50% midpoint, then labels Bullish when the current bar is above it, otherwise, Bearish.
You can choose which timeframes contribute and how agreement is determined: Strict (all selected must agree) or Majority (≥ N). The dashboard shows the overall bias and per-timeframe status with green ▲ (Bull) and red ▼ (Bear). It relies only on completed prior periods (no look-ahead) for stable signals and suits both intraday (e.g., D + H4) and swing (e.g., W + D + H4) workflows.
**Disclaimer:** This tool is for educational purposes only and is not financial advice. Always validate signals with your own analysis and backtests. Market conditions, data feeds, time zones, slippage, fees, and liquidity can affect outcomes. Past performance does not guarantee future results.
Информация о релизе
- New timeframes: H15 and H5 (toggle alongside Y, M, W, D, H4, H1).- Majority (≥ N) now supports up to N = 8 (auto-clamped to selected TFs).
- Status colors: green ▲ = Bull, red ▼ = Bear, gray = Off.
- Dashboard layout: Column 1 → H4, H1, H15, H5 | Column 2 → Y, M, W, D.
- Logic unchanged: uses prior period’s 50% midpoint; close > midpoint = Bull, else Bear.
Информация о релизе
Bug fixed for H15, H5 to M15, M5Скрипт с защищённым кодом
Этот скрипт опубликован с закрытым исходным кодом. Однако вы можете использовать его свободно и без каких-либо ограничений — читайте подробнее здесь.
Отказ от ответственности
Все виды контента, которые вы можете увидеть на TradingView, не являются финансовыми, инвестиционными, торговыми или любыми другими рекомендациями. Мы не предоставляем советы по покупке и продаже активов. Подробнее — в Условиях использования TradingView.
Скрипт с защищённым кодом
Этот скрипт опубликован с закрытым исходным кодом. Однако вы можете использовать его свободно и без каких-либо ограничений — читайте подробнее здесь.
Отказ от ответственности
Все виды контента, которые вы можете увидеть на TradingView, не являются финансовыми, инвестиционными, торговыми или любыми другими рекомендациями. Мы не предоставляем советы по покупке и продаже активов. Подробнее — в Условиях использования TradingView.