OPEN-SOURCE SCRIPT
SMA with ATR Bands
SMA with ATR Bands
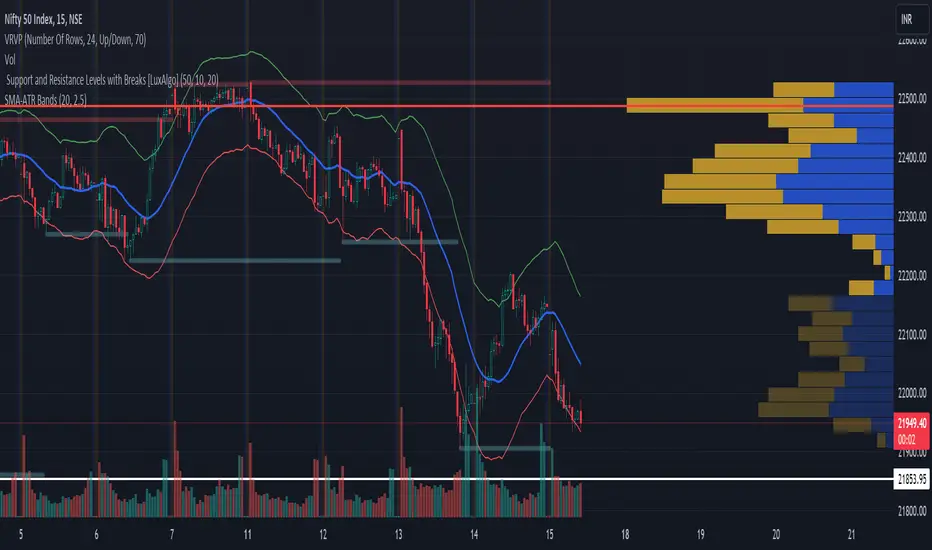
This custom indicator combines the Simple Moving Average (SMA) with Average True Range (ATR) bands. It’s designed to help traders identify potential price reversals and gauge volatility. Here’s what it does:
Simple Moving Average (SMA):
The SMA represents the average price over a specified period.
It acts as a trend-following line, smoothing out price fluctuations.
The blue line on the chart represents the SMA.
ATR Bands:
The ATR measures volatility by calculating the average range between high and low prices.
We add and subtract the ATR (multiplied by a user-defined factor) from the SMA to create the bands.
The green upper band and red lower band dynamically adjust based on volatility.
How to Use It:
Volatility Signals: When the bands are close together (a “squeeze”), it indicates low volatility. A breakout often follows.
Overbought/Oversold: Price touching the upper band suggests overbought conditions, while touching the lower band suggests oversold conditions.
Trend Confirmation: The indicator can confirm trends.
Feel free to use this indicator on TradingView to enhance your trading strategy. Remember to customize the parameters according to your preferences. Happy trading! 📈🚀
Скрипт с открытым кодом
В истинном духе TradingView, создатель этого скрипта сделал его открытым исходным кодом, чтобы трейдеры могли проверить и убедиться в его функциональности. Браво автору! Вы можете использовать его бесплатно, но помните, что перепубликация кода подчиняется нашим Правилам поведения.
Отказ от ответственности
Информация и публикации не предназначены для предоставления и не являются финансовыми, инвестиционными, торговыми или другими видами советов или рекомендаций, предоставленных или одобренных TradingView. Подробнее читайте в Условиях использования.